1 toolbar, 2 gcm status display area, Toolbar -4 – Yokogawa GC8000 Process Gas Chromatograph User Manual
Page 51: Gcm status display area -4
<4. Display and Operations while Connected to GC8000>
4-4
IM 11B06C01-01E
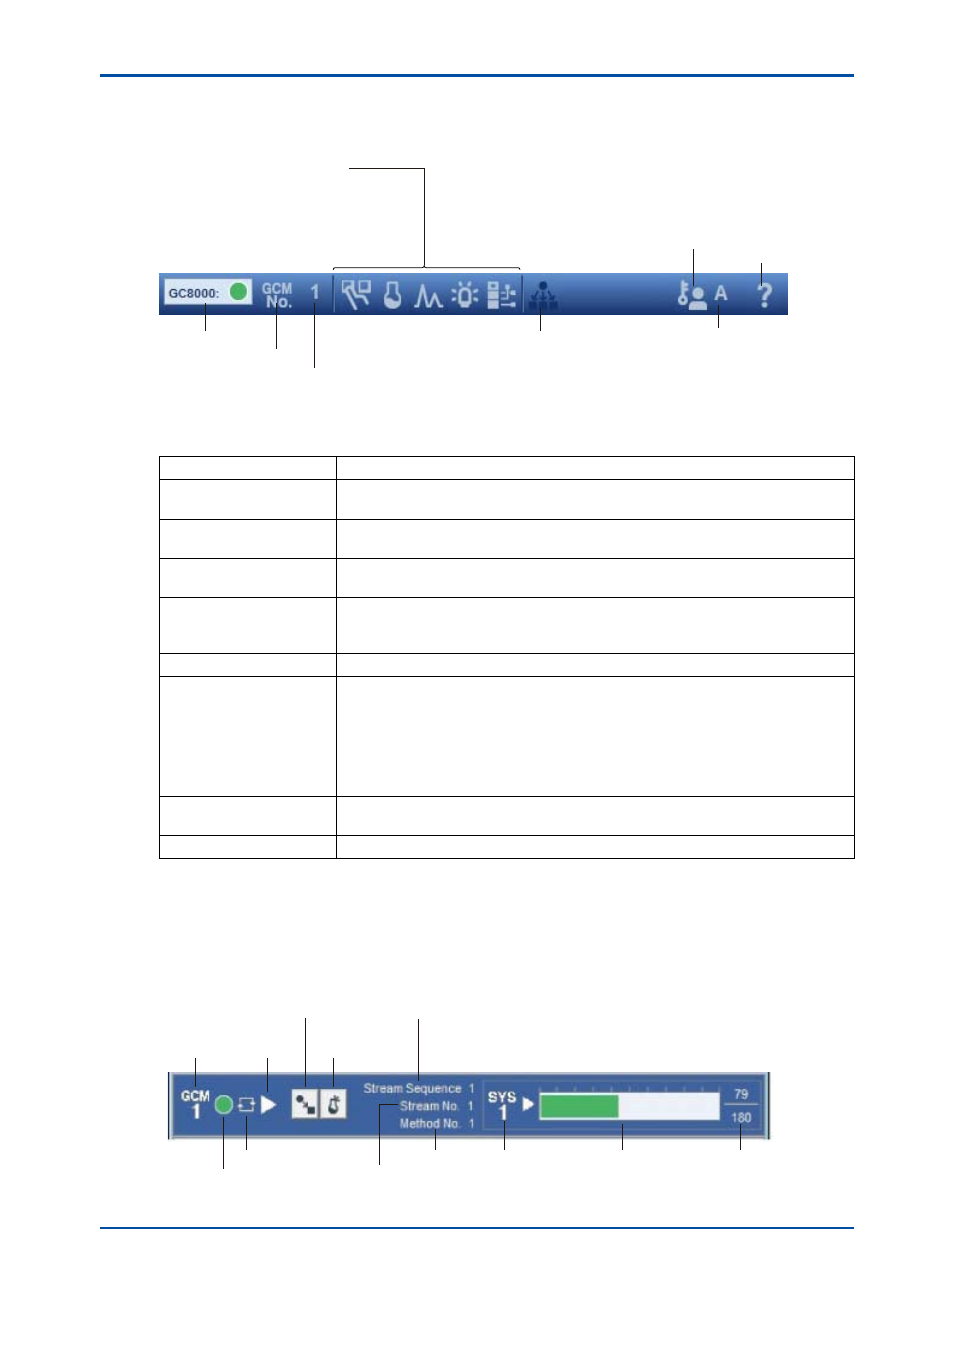
4.2.1 Toolbar
The toolbar consists of the toolbar buttons and the text window to indicate the ASET status.
Window Display button
Analyzer Operation window
Analysis Results windows
Chromatogram window
Alarm windows
Analyzer Status window
Change GCM
No. button
Change User
Level button
GC8000 Alarm
GCM No.
User Level
Change All VGC
Operation Mode button
Help button
Figure 4.3
Detailed explanation of toolbar
Table List of each element functions
Button/Display
Function and Display Information
Change User Level button Displays the Change User Level dialog box.
Use this button to change the user level (A, B, C, C+, or D).
Window Display button
Displays the relevant window. If a window cannot be displayed, its button is grayed
out.
Change GCM No. button
Displays the Change GCM Number dialog box. Use this button to change the
active GCM.
Change All GCM
Operation Mode button
Displays the Change All GCM Operation Mode dialog box.
This button changes the operation mode of all GCMs of the analyzer
simultaneously.
Help button
Displays a Help window.
GC8000 Alarm
Displays the alarm status of the entire GC8000. The most serious alarm status
level of each GCM is indicated.
l
Green: No alarm
l
Yellow: Level-2 alarm has occurred.
l
Red: Level-1 alarm has occurred.
The alarms have the following severity levels. Level 1 is the highest level of
severity. Level 1 → Level 2 → (Level 3) → No alarm
GCM#
Indicates the active GCM number.
This is empty (deselected) when this window is opened.
User Level
Displays the currently set user level.
4.2.2 GCM Status Display Area
The GCM Status Display area shows each GCM status of the GC8000. The number of display
areas depends on the GCM count (1 to 6) held by the GC8000.
GCM Alarm Status
GCM No.
Operation
Mode
Measurement Status
System No.
Elapsed time/System
Analysis cycle
Elapsed time
bar graph
Stream No.
Measurement status
Method No.
Changed Operation Mode Number
Display Analysis
Result button
Figure 4.4
Detailed description of GCM Status Display area
5th Edition : Nov. 16, 2011-00