1 overview window, 1 analyzer status window for gc1000 mark ii, Overview window -2 5.1.1 – Yokogawa GC8000 Process Gas Chromatograph User Manual
Page 112: Analyzer status window for gc1000 mark ii -2, Lconfiguration, Lfunctions and display information of elements
<5. Display and Operations while Connected to GC1000 Mark II>
5-2
IM 11B06C01-01E
5.1
Overview Window
5.1.1
Analyzer Status Window for GC1000 Mark II
l
Configuration
The Analyzer Status window is the main part of the Overview window. It displays the latest
operation statuses of up to 16 analyzers that have been specified in advance, and updates
display data automatically at 1-second intervals. You can click a button in the window to change
the operation mode or to display the Latest Analysis Results window.
• The analyzers displayed in the Analyzer Status window when the Overview window is
displayed for the first time after installation are those automatically selected from the
analyzers specified for the analyzer server. To change this to display the required analyzers,
execute the Set Page command in the Display Setting menu.
F5-1-1. ai
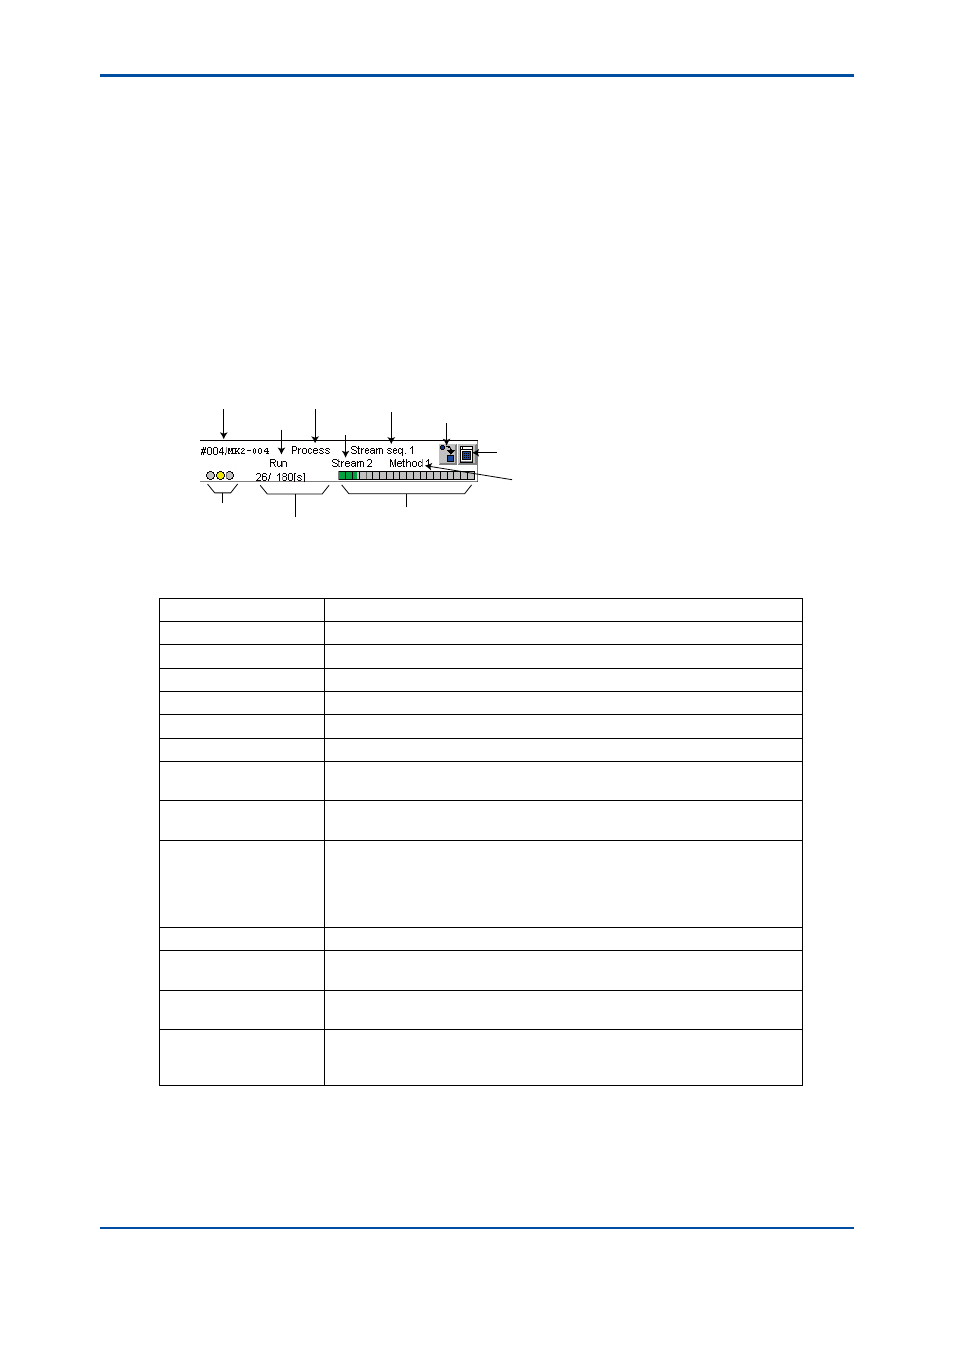
Analyzer ID/tag
Operation
Mode
Alarm Status
Elapsed time/Analysis cycle
Elapsed time bar graph
Method No.
Display Analysis Result button
Change Operation Mode button
Measurement Status
Stream No.
Status
l
Functions and Display Information of Elements
Button/Display
Function and Display Information
Analyzer ID
Indicates the ID number of the displayed analyzer.
Status
Indicates the current status of the displayed analyzer ID.
Measurement Status
Indicates the current measurement status of the displayed analyzer ID.
Operation Mode
Indicates the current operation mode of the displayed analyzer ID.
Stream No.
Indicates the current stream number of the displayed analyzer ID.
Method No.
Indicates the current method number of the displayed analyzer ID.
Change Operation
Mode button
Displays the dialog box for changing the operation mode of the displayed
analyzer. Only level-B or -C users can use this button.
Display Analysis Result
button
Displays the Latest Analysis Results window. The Latest Analysis Results
window can display the results of multiple analyzers simultaneously.
Alarm Status
Displays the current alarm status as follows. Moreover, double clicking the
alarm status causes the Alarm Status window of that analyzer to appear.
Illuminated in green: No alarm
Illuminated in yellow: Level-2 alarm occurred.
Illuminated in red:
Level-1 alarm occurred.
Elapsed time
Indicates the current elapsed time in seconds.
Analysis cycle
Indicates the analysis cycle of the current analysis. This is indicated only
when the information can be obtained in Process mode.
Elapsed time bar graph
When the analysis cycle is obtained, this displays the current analysis
progress condition of the displayed analyzer in a bar graph.
(Enable)/Disable
Indicates the current connection status of the displayed analyzer with
respect to the analyzer server. “Disable” is indicated if connection is not
possible; otherwise, the field remains blank.
5th Edition : Nov. 16, 2011-00