Ncalibration coefficient history window, Lwindow configuration, Ldisplay contents – Yokogawa GC8000 Process Gas Chromatograph User Manual
Page 152
<5. Display and Operations while Connected to GC1000 Mark II>
5-42
IM 11B06C01-01E
l
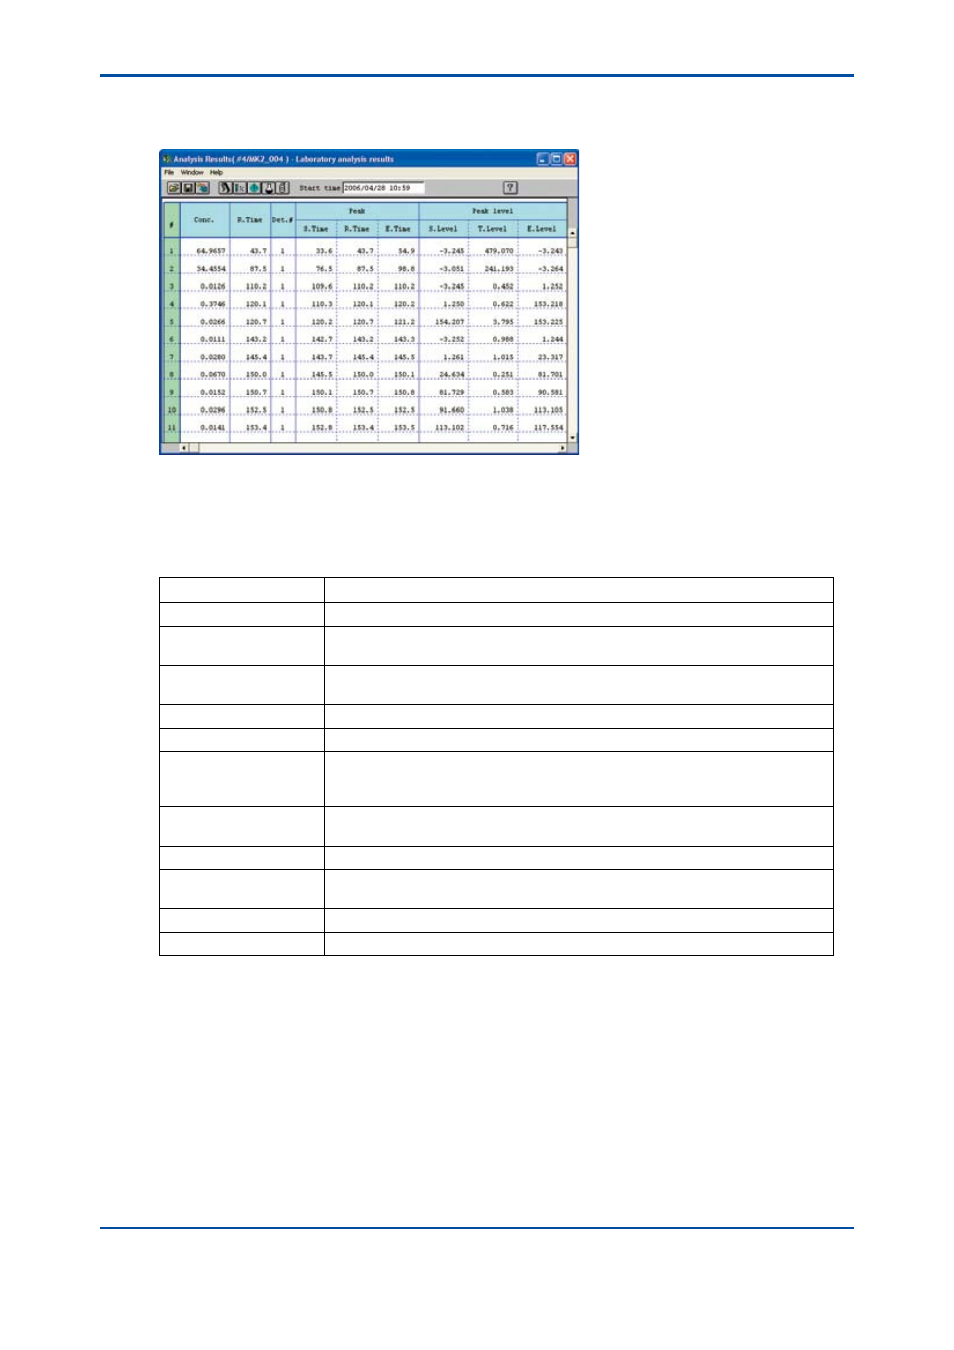
Window configuration
The following shows the configuration of the Laboratory Analysis Results window.
F5-4-6.ai
Portions of data hidden from view in the window can be seen using the scroll bar.
l
Display contents
The following lists the display contents for each item.
Item
Display Contents
Analysis Start Time
Displays the date and time at which analysis of the display data was started.
#
Indicates the numbers of the order in which the peaks have been detected: 1 to
255.
Concentration
Indicates concentration for each peak (with the unit indicated after the peak
name).
Retention Time
Indicates Retention time (second) for each peak.
Det. #
Indicates detector number (1 or 2) for each peak.
Peak
Peak start/ Retention/
Peak end
Indicates peak process start time/Retention time/end time (second) for each
peak.
Peak Level
Start/Height/End
Displays the peak start level/top level/end level (mV) for each peak.
Area
Indicates the integral value of the peak level (mV second) for each peak.
Shape
Indicates the peak data process status in two-digit letters for each peak. It
displays “P” for tangent correction re-setting or “H” for the perpendicular method.
Half-value Width
Indicates a half-value width (second) for each peak.
Tailing Constant
Indicates a tailing constant for each peak.
n
Calibration Coefficient History Window
The Calibration Coefficient History window is intended to reference temporal changes in
calibration coefficient data analyzed by the analyzer up to the current instant. It can recall past
data stored in the analyzer server at any time using the Open History command in the File menu.
Moreover, you can select past calibration coefficient data that the analyzer server has and
display it from the time concerned.
A maximum of 250 instances of calibration coefficient data that has been acquired up to
the current instant can be displayed at once as to all streams. (Columns in which no peak
concentration was measured at the time concerned are left blank).
5th Edition : Nov. 16, 2011-00