Caution, Ldisplay contents – Yokogawa GC8000 Process Gas Chromatograph User Manual
Page 149
<5. Display and Operations while Connected to GC1000 Mark II>
5-39
IM 11B06C01-01E
CAUTION
When an operation pattern or peak value setting is changed while an analysis results window is
being displayed:
(First close the analysis results window by executing the Exit command in the File menu, and
exit the Engineering Terminals. Then restart the Engineering Terminals and re-open the analysis
results window. Continuing operations without restarting all the Engineering Terminals may result
in incorrect data display.
l
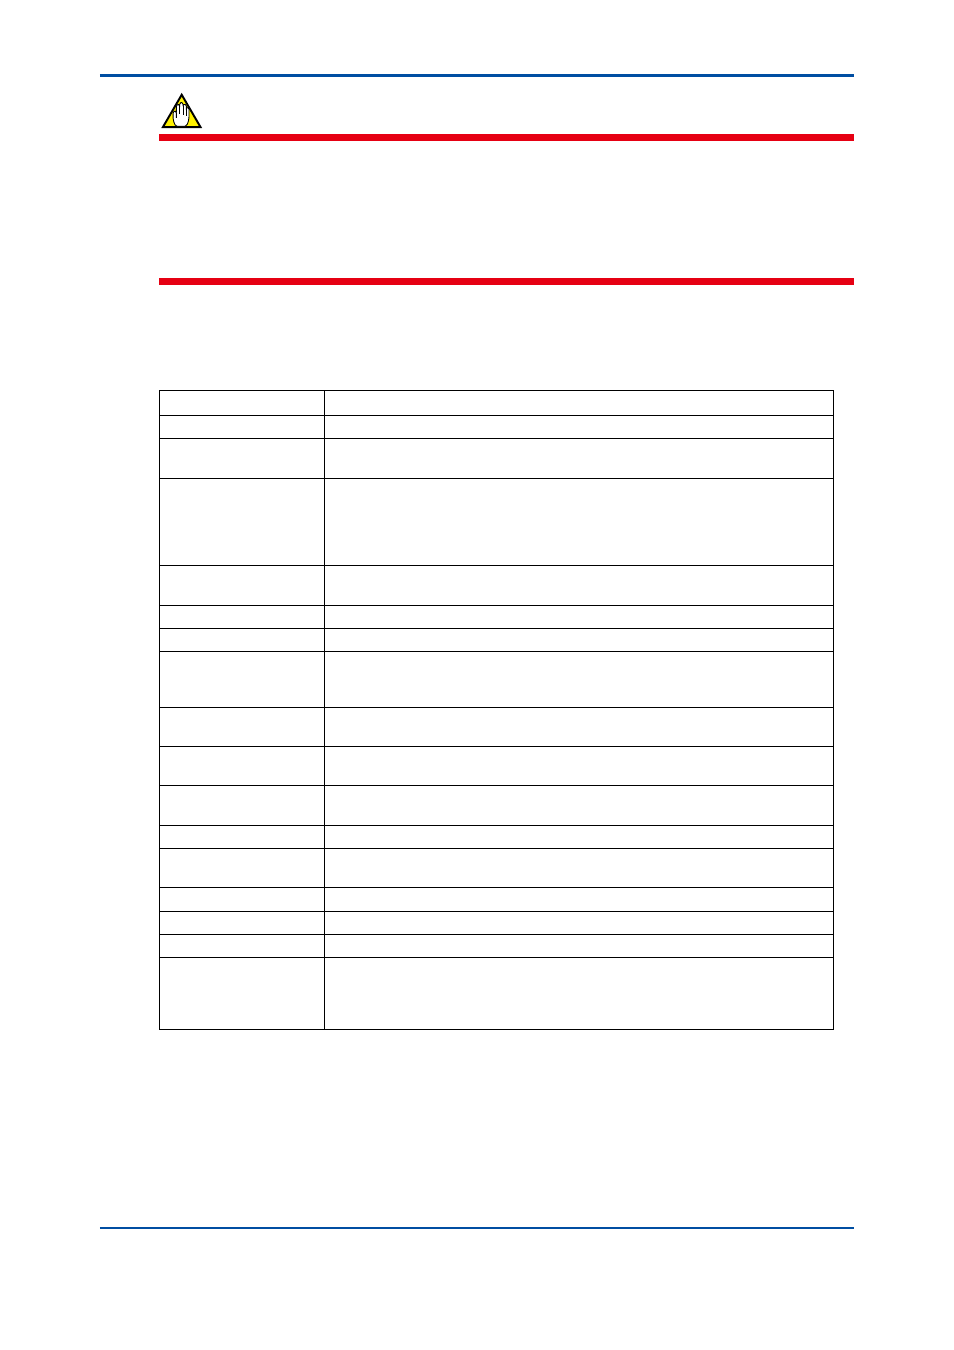
Display contents
The following lists the display contents for each item.
Item
Display Contents
Analysis Start Time
Displays the date and time at which analysis of display data was started.
#
Indicates the absolute numbers of peaks (serial numbers for all peaks of all
tasks): 1 to 255.
Stream# - Peak# - Peak
Name
Indicates the peaks of a stream for which the latest analysis has been made, in
the ascending order of peak numbers (order of assignment).
A stream number, peak number, and peak name are connected and indicated in
this order using “-”, and the concentration unit (%, ppm, or no unit) of that peak is
indicated in parentheses at the end.
Concentration
Indicates concentration for each peak (with the unit indicated after the peak
name).
Retention Time
Indicates Retention time (second) for each peak.
Det. #
Indicates detector number (1 or 2) for each peak.
Peak
Peak start/Retention/
Peak end
Indicates peak process start time/Retention time/end time (second) for each
peak.
Gate
Gate start/Gate end
Indicates gate start time/end time (second) for each peak.
Pursuit
Indicates the peak pursuing status for each peak as “standard”, “pursuit”, or
“none”.
Peak Level
Start/Height/End
Displays the peak start level/top level/end level (mV) for each peak.
Area
Indicates the integral value of the peak level (mV second) for each peak.
Shape
Indicates the peak data process status in two-digit letters for each peak. It
displays “P” for tangent correction re-setting or “H” for the perpendicular method.
Half-value Width
Indicates a half-value width (second) for each peak.
Tailing Constant
Indicates a tailing constant for each peak.
Variation Coefficient
Indicates a concentration variation coefficient for each peak.
Method
Indicates a concentration computation method for each peak, selecting
the applicable concentration computation method from “corrected area,”
“calibration,” “external third,” “external linear,” “indirect method.”
(If no applicable method is found, “????????” is indicated.)
* Note: If commas (,) are used in stream names or peak names, the features of the analysis results windows may not function properly.
5th Edition : Nov. 16, 2011-00