Ntoolbar, Nenlargement display area, Lwindow elements – Yokogawa GC8000 Process Gas Chromatograph User Manual
Page 134: Lcontents of display
<5. Display and Operations while Connected to GC1000 Mark II>
5-24
IM 11B06C01-01E
n
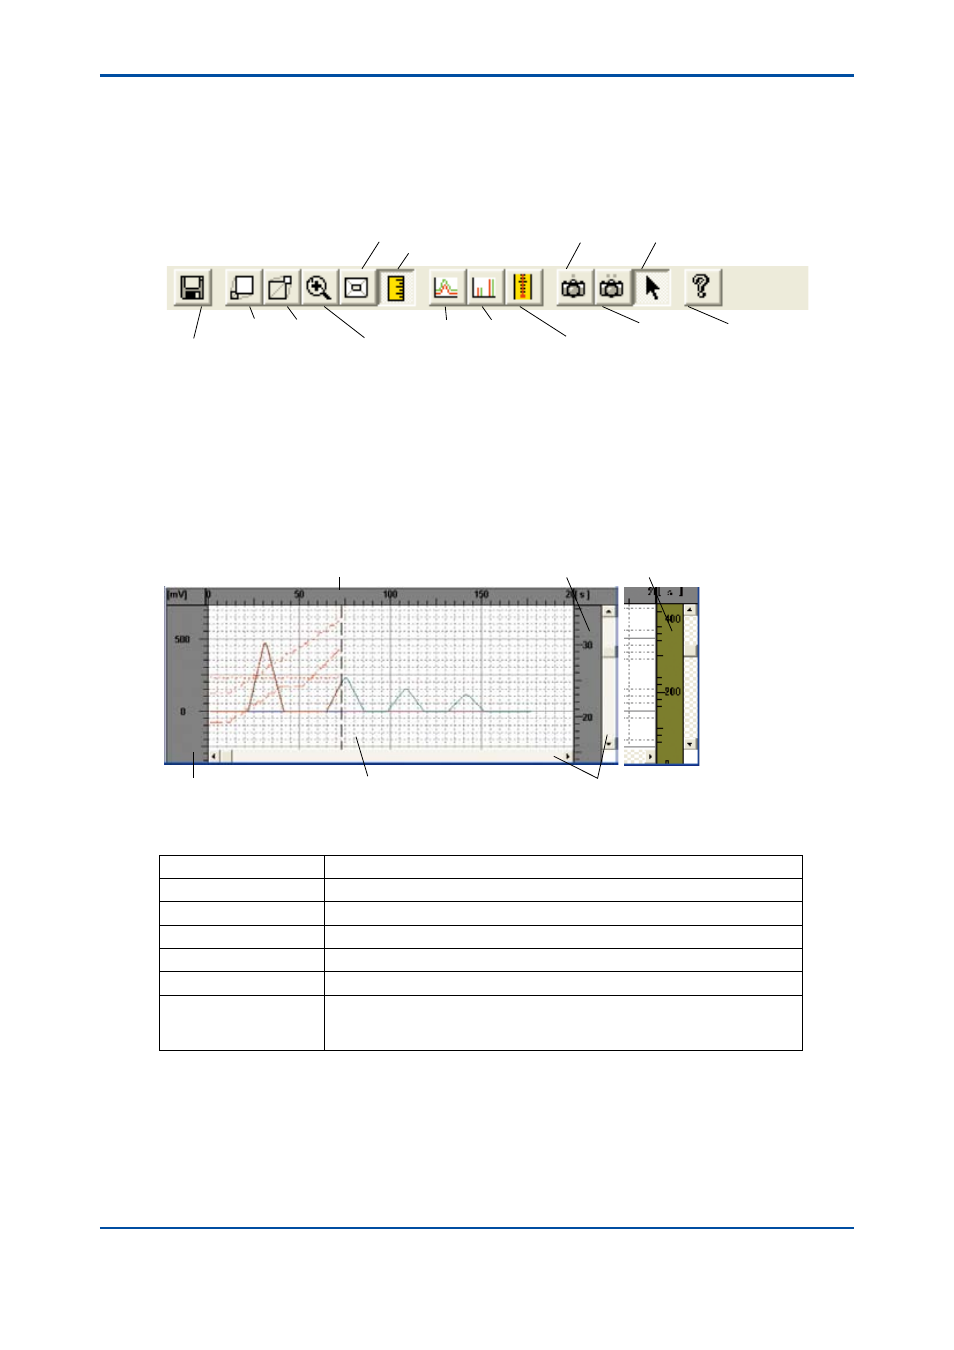
Toolbar
The toolbar has had frequently used commands registered as buttons.
l
Window elements
The toolbar consists of the following buttons:
F5-3-3.ai
Save
Chromatogram
button
Enlarge
button
Reduce
button
Partial
Enlargement
button
Auto Scale button
Overall Display button
Set Pen
button
Set Mark
button
Temperature
Display
button
Snap 1
Mouse Position Display button
Snap 2
Help
button
n
Enlargement Display Area
This area of the Chromatogram window displays chromatogram and temperature.
l
Window elements
F5-3-4.ai
X-axis scale
Temperature scale
The vertical scale can be switched from
temperature to pressure by double clicking.
Pressure scale
Scroll bars
Y-axis scale
Grid
l
Contents of display
Item
Function
X-axis scale
Represents elapsed time (second).
Y-axis scale
Represents voltage value (mV).
Temperature scale
Represents temperature (°C).
Pressure scale
Represents pressure (kPa).
Scroll bar
Moves chromatogram up and down or sideways to show hidden portions.
Grid
Grid-like auxiliary lines linked with the X-axis and Y-axis scale graduations.
The grid can be made visible or invisible by setting its ON/OFF status using
the Grid command in the Option menu.
5th Edition : Nov. 16, 2011-00