Ndisplaying temperature/pressure data – Yokogawa GC8000 Process Gas Chromatograph User Manual
Page 140
<5. Display and Operations while Connected to GC1000 Mark II>
5-30
IM 11B06C01-01E
F5-3-12.ai
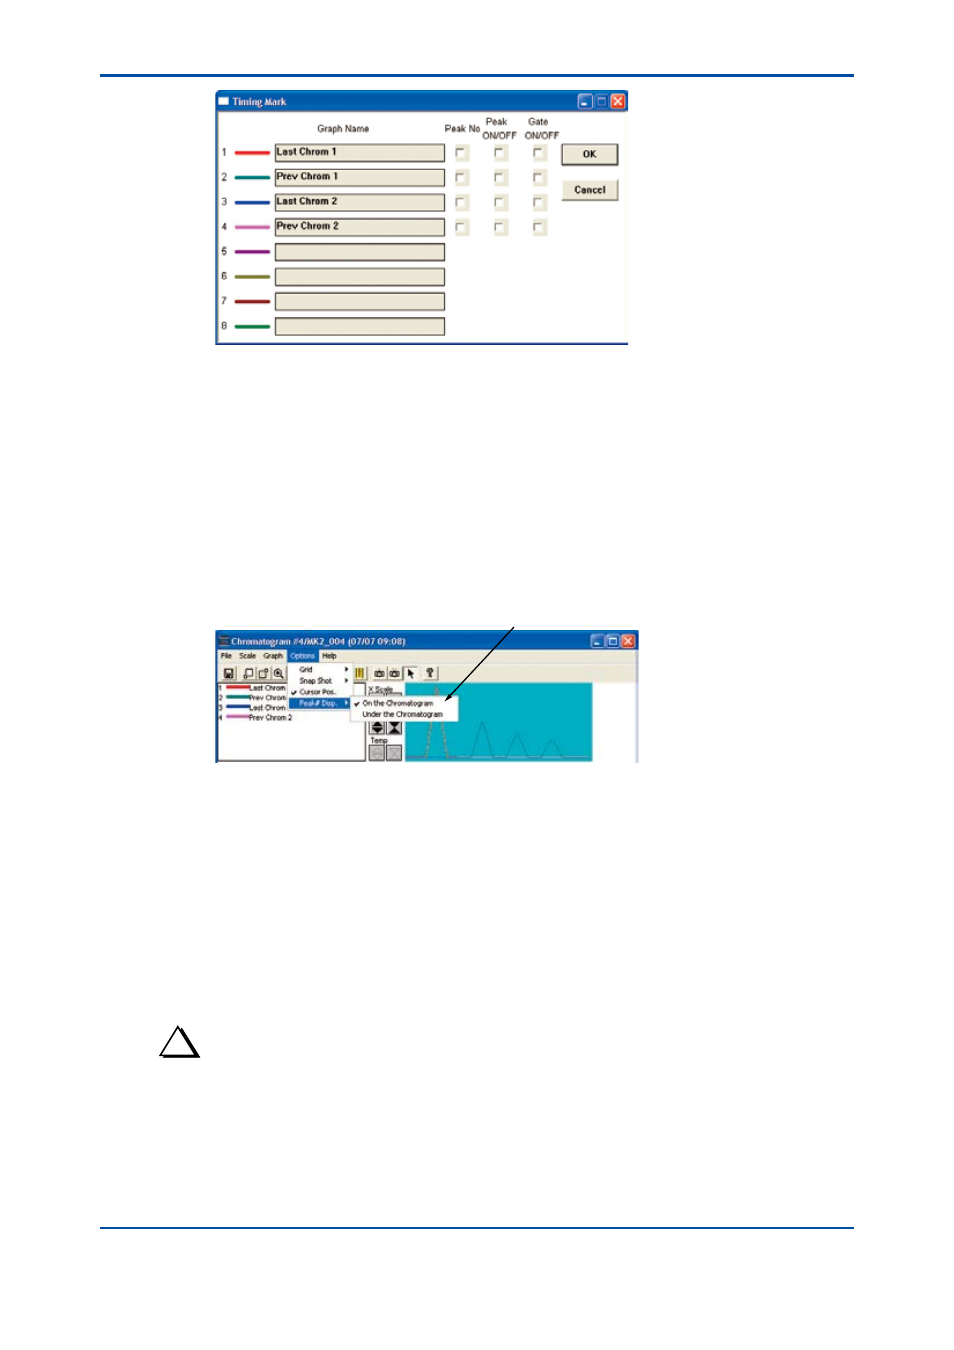
(2) Set the provision of mark information display for each chromatogram as follows:
Checked:
Displayed
Unchecked:
Not displayed
(3) Click the OK button.
The set mark information is displayed.
l
Setting peak number position
(1) Click on the Peak Display Position command in the Option menu.
The submenus of the Peak Display Position command appear.
Indicates the current setting.
F5-3-13.ai
(2) Click the Above Graph or Below Graph.
This causes the peak display position to be defined.
n
Displaying Temperature/Pressure Data
Temperature data corresponding to the specified chromatogram can be displayed in the
Enlargement Display area. Temperature data is displayed by dotted lines in the same color as
the target chromatogram. Pressure graph 1 is displayed by dashed lines in the same color as the
corresponding chromatogram. Pressure graph 2 is displayed by alternate long and short dashed
lines in the same color as the corresponding chromatogram. Up to two pressure graphs can be
displayed.
TIP
The types of chromatograms that can be displayed together with temperature data are the latest chromatograms,
previous chromatograms, and file chromatograms containing either the latest or previous chromatograms.
If a chromatogram displaying temperature data is erased, the corresponding temperature data is also erased
automatically.
5th Edition : Nov. 16, 2011-00