Wave expert – Teledyne LeCroy WaveExpert 100H Operators Manual User Manual
Page 273
Wave Expert
WE-OM-E Rev A
271
apart from the wobble caused by the trigger-to-sample clock difference. If the trace length is
nominally 500, the right edge of the screen coincides with DataArray(500), which is the 501
st
point.
The last point, number 502, is just off the right of the screen, and is never seen. That is why the loop
in the script runs only to endData - 1.
OutResult.Samples is the number of data in the output trace, and is set to be the same as the
number of data in the input trace. If you set the output length less than the input length, you get a
shorter trace, the remainder being made of zeroes. If you try to set the output values to something
illegal, you may find that a part of the trace retains the values from a previous acquisition.
If you try to set something outside the bounds of an array, or you make some other error, or
something overflows, or you ask for something impossible, such as log(-13), the instrument tells
you the line number, and the nature of the problem. Other types of error may not be given the
correct line number, for example, if "Next" or "End If" is omitted, because VBS does not know where
it should have been.
UnscaledData is simply a copy of the input data set.
ReDim newDataArray(OutResult.Samples) defines an array of data for use as a scratch pad. Dim
is short for Dimension, which is used in Visual Basic to declare a variable (even if it only has one
element, in which case you omit the size of the array).
InResult.DataArray(False) means that the data are signed integers in the range -32768 to 32767.
False is a Boolean value applying to the property Scaled. Scaled data are specified in the units of
the vertical scale, such as volts. You get these by putting "True" instead of "False". If you want to
make a section of the output trace invisible, you simply set the data values to full scale or bigger,
top or bottom.
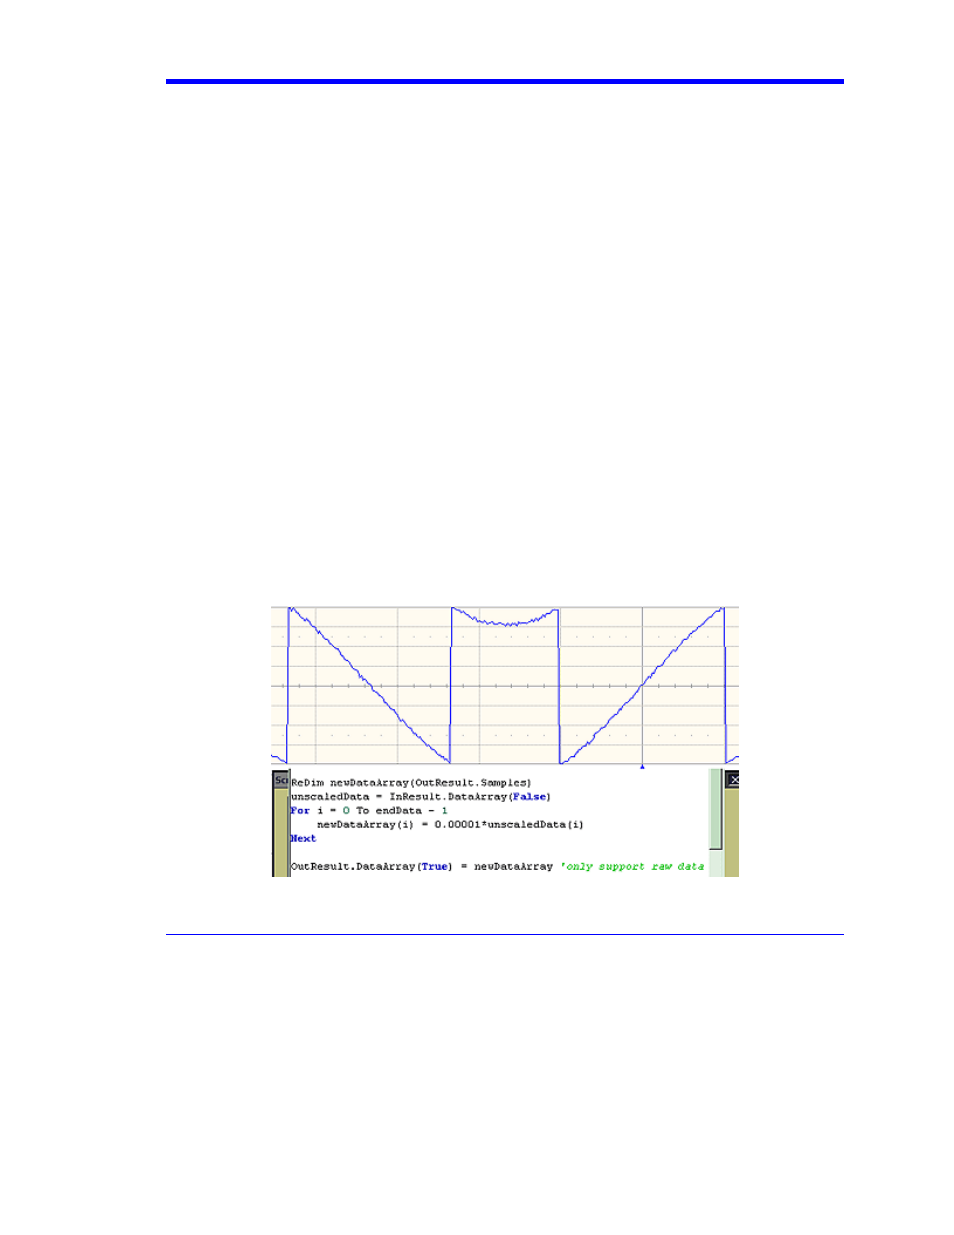
You can start with the unscaled data (False) as input, and then set the output data to scaled data
(True), and you can go from scaled to unscaled. Using scaled data, an overflow will make a picture
like this:
You can also start with True and convert to False, but in this case overflows will cause an error
message.