Teledyne LeCroy WaveExpert 100H Operators Manual User Manual
Page 104
Operator’s Manual
102
WE-OM-E Rev A
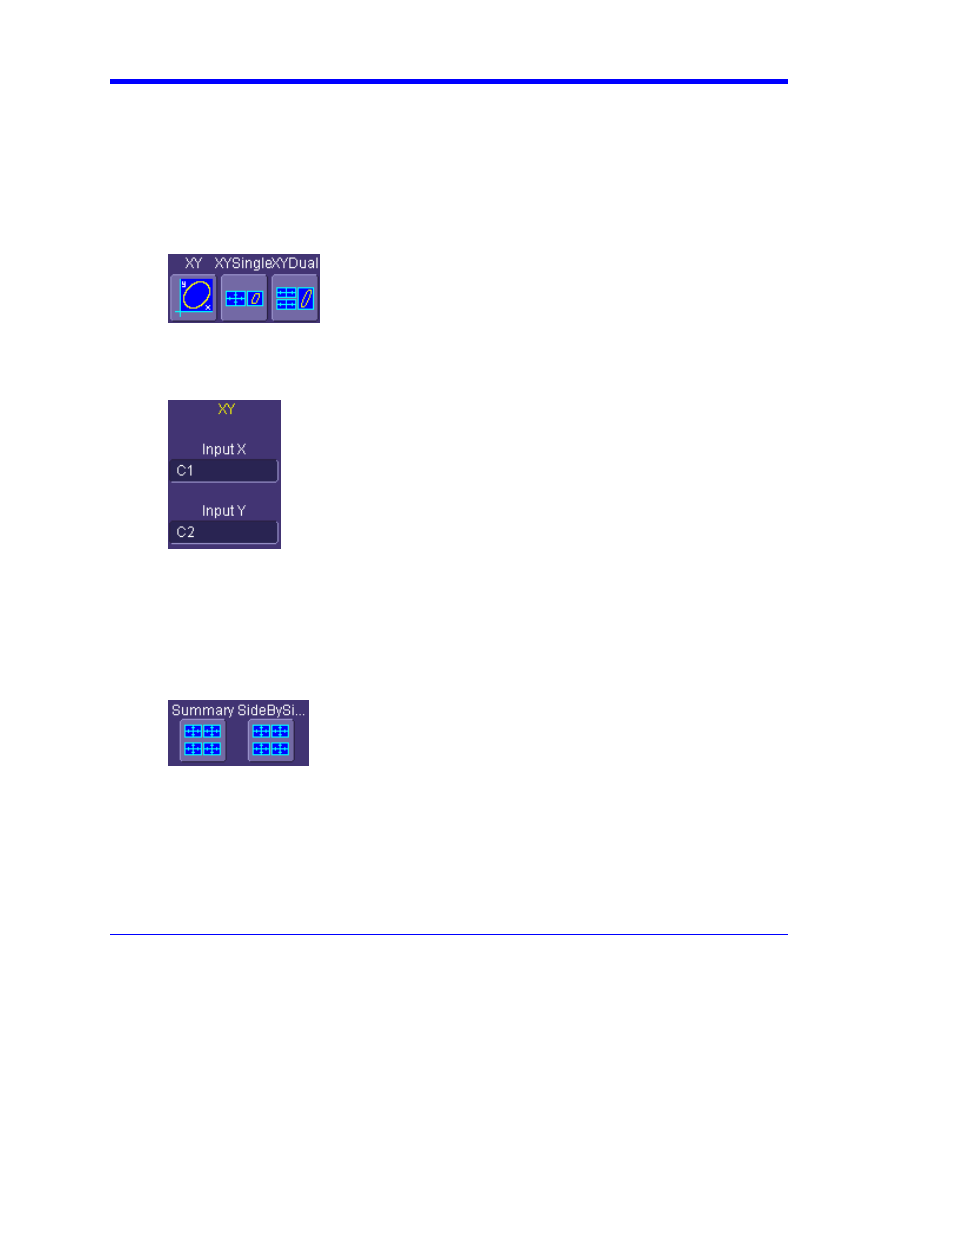
XY Display
Use XY displays to measure the phase shift between otherwise identical signals. You can display
either voltage on both axes or frequency on both axes. The traces must have the same X-axis. The
shape of the resulting pattern reveals information about phase difference and frequency ratio.
To Set Up XY Displays
1. In the menu bar, touch Display; then touch Display Setup... in the drop-down menu.
2. Choose an XY display by touching one of the XY display mode buttons
.
You have the choice of showing the two waveforms on just the XY grid, or you can also
show the input waveforms on a single or dual grid.
3. Touch
inside
the
Input X and Input Y data entry fields and select your input sources from
the pop-up menus.
The inputs can be any combination of channels, math functions, and memory locations.
Summary Displays
The summary displays offer an alternative way to view multiple traces in side-by-side windows.
This type of display gives more vertical detail at the cost of some horizontal resolution in the
display.
1. In the menu bar, touch Display; then touch Display Setup … in the drop-down menu.
2. Choose a summary display by touching one of the summary mode buttons
.
You have the choice of a four-quadrant display or a dual, side-by-side display.