Operator’s manual – Teledyne LeCroy WaveExpert 100H Operators Manual User Manual
Page 230
Operator’s Manual
228
WE-OM-E Rev A
color-graded eye pattern display.
Jitter Setup Dialog -- View Selector
This set of controls enables or disables the available jitter
views when measuring jitter in the repeating pattern
mode.
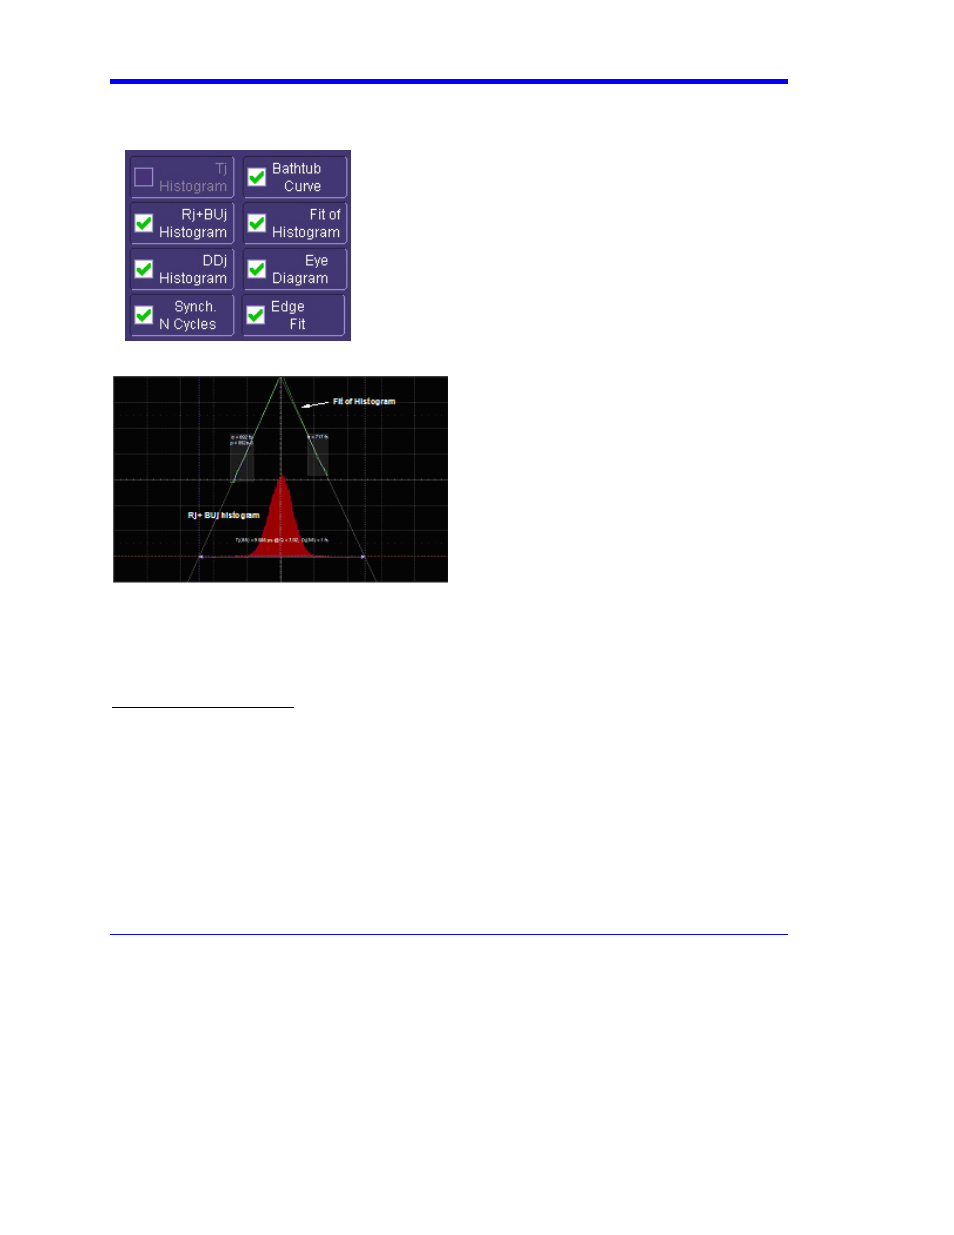
Rj+BUj Histogram (RjHist)
This display shows the histogram of the combined random and bounded uncorrelated jitter (BUj).
This is the histogram of timing differences between the CIS timebase sampling clock and the signal
transitions. The histogram contains timing information for every edge in the data pattern within the
fit region (see figure). The slope of the edge in the fit region is used as the mean value for the
histogram of each edge.
Fit of Histogram (RjBUjFit)
The two green lines are the renormalized Q-scale of the histogram. They appear as lines for the
case where the histogram is Gaussian; but, in general, the upper portion is curved while the lower
portion is linear. The light gray lines that extend the length of the grid are the best-fit lines to the
linear portion of the Q-scale within the light-gray rectangles on either side of the Q-scale plot. The
lines are extended to the top of the grid, and their separation at this point gives the bounded portion
of the histogram or the BUj.
The distance between the lines at the vertical displacement corresponding to the selected bit error
rate gives the peak-to-peak total Rj + BUj jitter. Shown at the bottom of this plot is the equivalent Q
value for this BER.