Teledyne LeCroy WaveExpert 100H Operators Manual User Manual
Page 116
Operator’s Manual
114
WE-OM-E Rev A
HISTOGRAMS
Creating and Viewing a Histogram
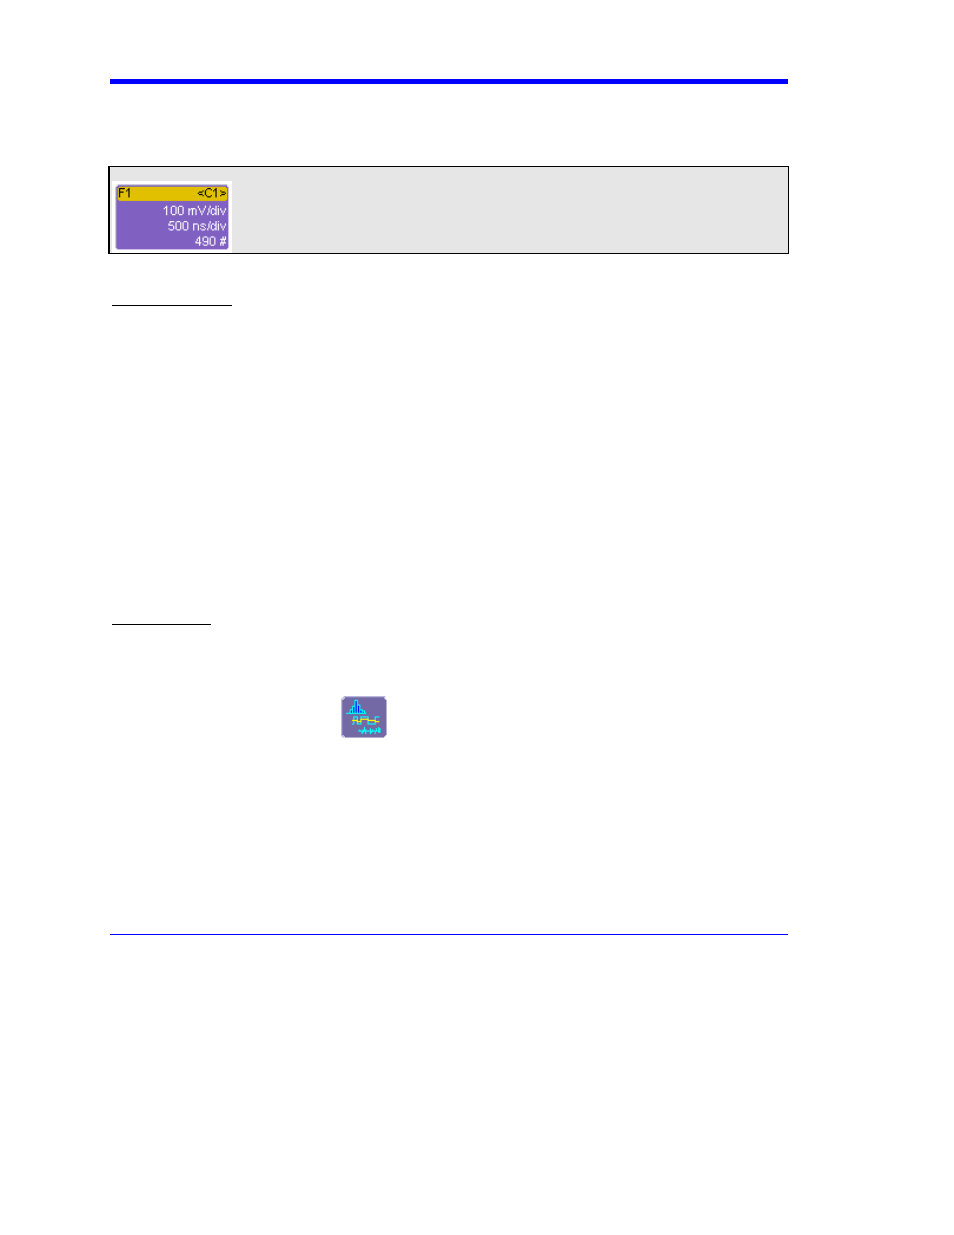
Note: The number of sweeps comprising the histogram will be displayed in the bottom line of the trace descriptor label:
To Set Up a Single Parameter Histogram
From Measure Dialog
1. In the menu bar, touch Measure, then Measure Setup.
2. Touch
the
My Measure button.
3. Touch one of tabs P1 through Px.
4. Touch
inside
the
Source1 field and select an input waveform from the pop-up menu.
5. Touch
inside
the
Measure field and select a parameter from the pop-up menu.
6. Touch
the
Histogram button at the bottom of the dialog.
7. Touch a math trace in which to place the resulting histogram, then close the pop-up menu.
8. Touch the math trace label for the math trace you just created.
9. In the dialog to the right, touch the Histogram tab.
10. Under "Buffer," touch inside the #Values data entry field and enter a value.
11. Under "Scaling," touch inside the #Bins data entry field and enter a value from 20 to 2000.
12. Touch the Find Center and Width button to center the histogram. Or touch inside the
Center, then the Width, data entry fields and enter a value using the pop-up numeric
keypad.
From Math Dialog
1. In the menu bar, touch Math, then Math Setup.
2. Touch one of function tabs F1 through Fx. (The number of math traces available depends
on the software options loaded on your scope. See specifications.)
3. Touch
the
Graph button
.
4. Touch
inside
the
Source1 field and select a source from the pop-up menu.
5. Touch
inside
the
Measurement field and select a parameter from the pop-up menu.
6. Touch
inside
the
Graph with field and select Histogram from the pop-up menu.
7. In the dialog to the right, touch the Histogram tab.
8. Under "Buffer," touch inside the #Values data entry field and enter a value from 20 to 1000.
9. Under "Scaling," touch inside the #Bins data entry field and enter a value from 20 to 2000.
10. Touch the Find Center and Width button to center the histogram. Or touch inside the
Center, then the Width, data entry fields and enter a value using the pop-up numeric