Wave expert – Teledyne LeCroy WaveExpert 100H Operators Manual User Manual
Page 231
Wave Expert
WE-OM-E Rev A
229
The slope of each line is expressed as the sigma value shown in the corresponding gray box.
Additionally, the box on the left shows the value of rho, which is the normalization factor. The rho
value is shown for informational purposes only and is set automatically.
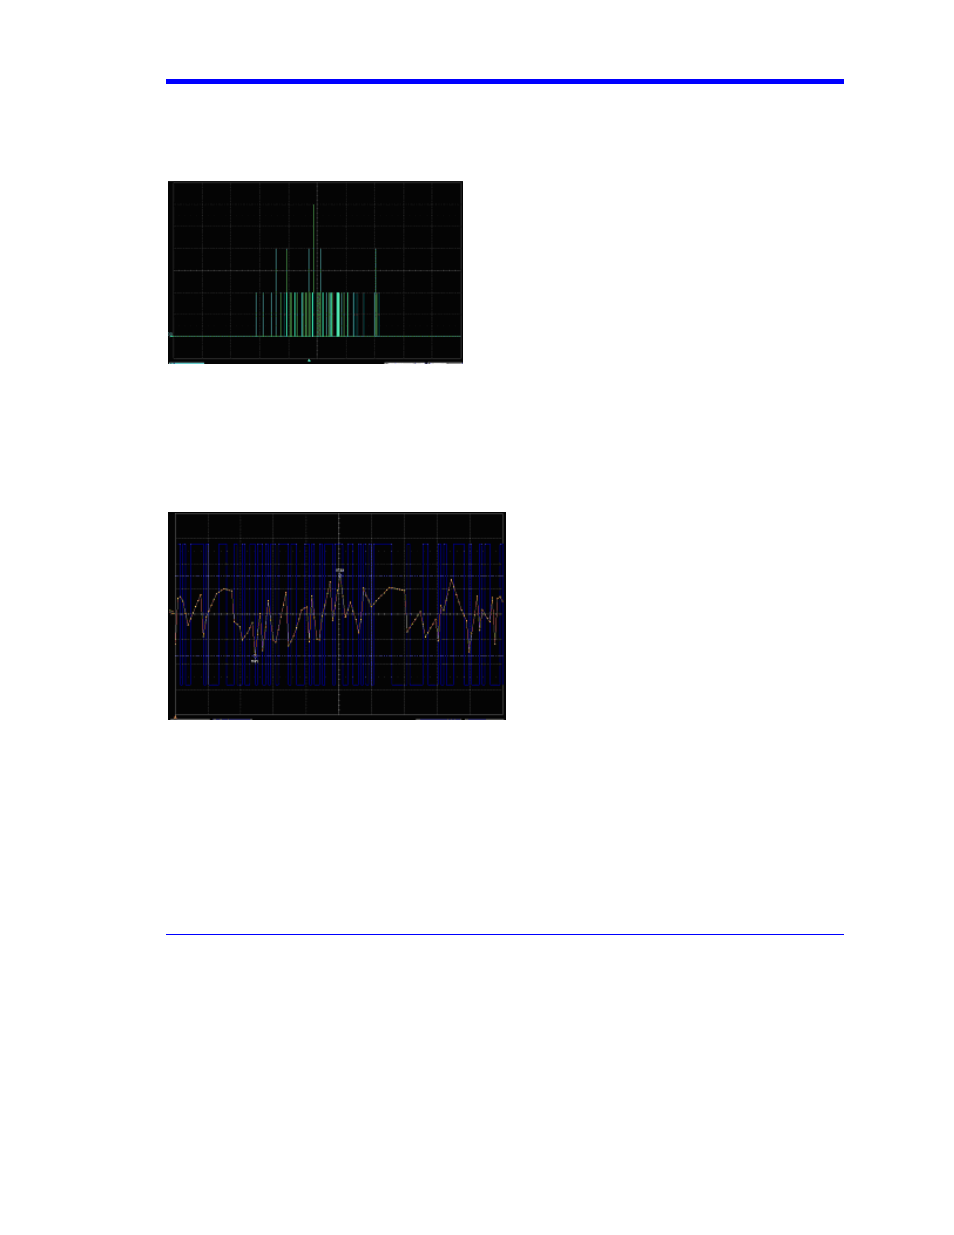
DDj Histogram (DDjHist)
This is the histogram of the mean values of each transition in the data pattern as measured in the
Synchronous n-cycle plot. The horizontal units of this plot are seconds, with zero in the center,
“early” edges to the left, and “late” edges to the right. Dimensionless, the vertical scale indicates the
number of occurrences of each delay. The population of the histogram is exactly equal to the
number of edges in the data pattern. For example, a PRBS7 pattern, which has 64 transitions, will
have a DDj histogram with a population of 64.
Sync. N Cycles (SnCycle)
The synchronous n-cycle plot displays the error in the mean location of each signal edge, relative to
its ideal location. An ideal bit pattern at a given bit rate will have transitions at multiples of 1/B
seconds, where B is the bit rate. Dispersion and other effects in the data channel, however, result in
certain bits within a pattern arriving early or late. The mean crossing time of each edge in the
pattern is determined as shown in the figure above.
The intersection of the best-fit line through all the samples on a given edge with the threshold set by
the Crossing Level control determines the mean crossing point for that edge. The synchronous
n-cycle plot displays the mean crossing for each edge. The vertical center of the plot is zero error,
with points above this representing “early” edges and points below the line representing “late”
edges. The vertical scale depends on the amount of data dependent jitter (DDj) and the