Operator’s manual – Teledyne LeCroy WaveExpert 100H Operators Manual User Manual
Page 232
Operator’s Manual
230
WE-OM-E Rev A
peak-to-peak range of the plot gives the value of DDj. The horizontal scale of this plot is in units of
time, and the blue trace in the background depicts the bit sequence as a reference for each
transition. The horizontal range of the synchronous n-cycle plot covers the entire bit pattern and, in
cases where the pattern is thousands of bits long, it may be impossible to see individual edges in
the plot. Two cursors on the plot show the location of the maximum (earliest) edge and minimum
(latest) edge, which define the peak-to-peak range.
Bathtub Curve (BathTub)
This is a plot of the bit error rate of the signal under test as a function of the sampling point within
the eye. The horizontal scale of the bathtub is in units of UI, with the left edge being 0 UI and the
right at 1 UI. The left and right edges of the plot are equivalent to the crossing points of the eye
diagram. The vertical scale is the logarithm of the bit error rate with the top of the graph
representing a BER of 1 (10
0
) and the bottom at 10
-16
. The scale is 2 decades per division. The
characteristic “bathtub” results because the bit error rate rapidly decreases to a low level in the
center of the curve and is high at the sides.
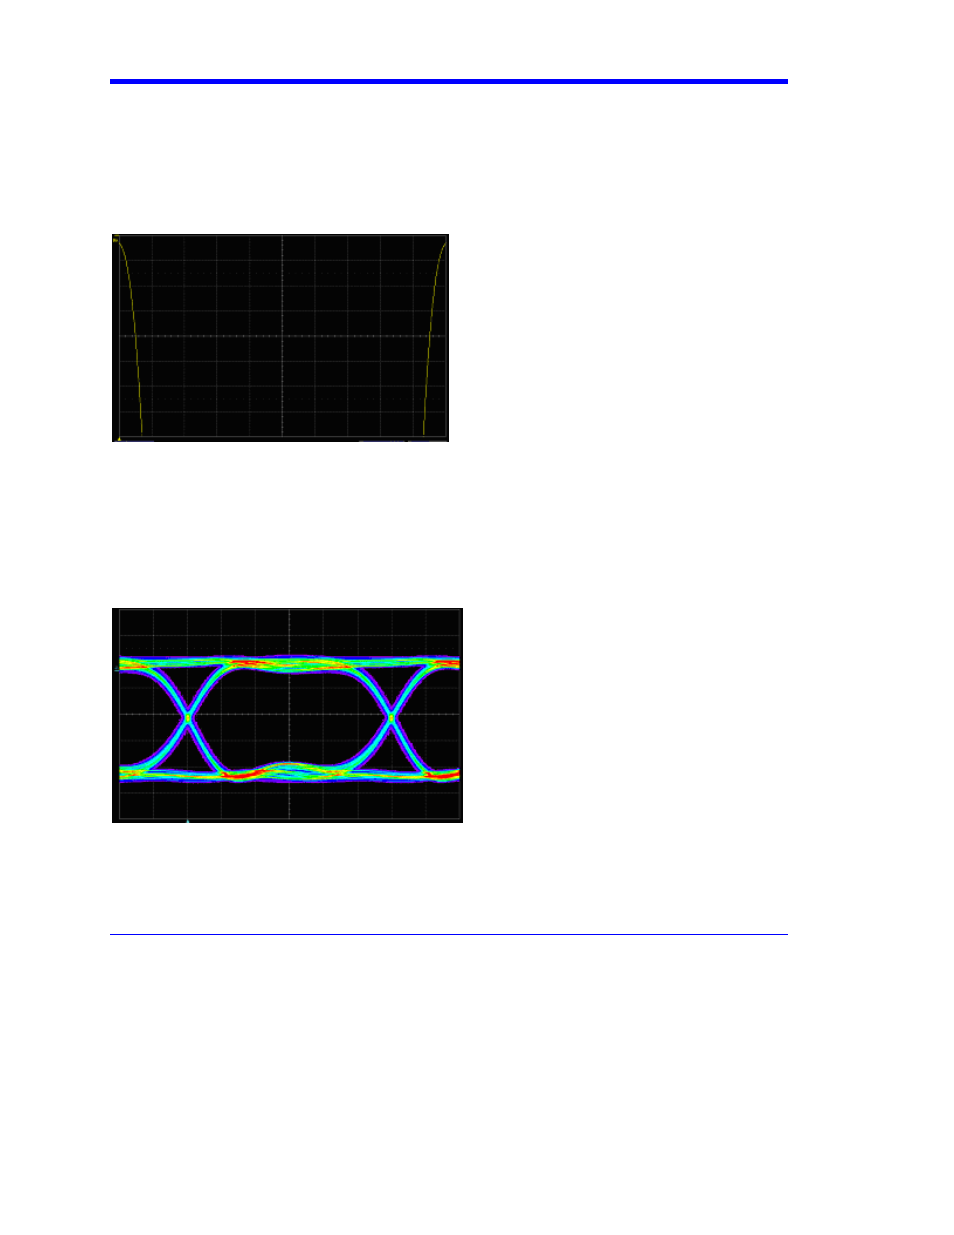
Eye Diagram (JitEye)
This diagram shows the eye diagram of the signal data used in the jitter measurement. The plot is a
true persistence map that expresses each voltage and time value with its frequency of occurrence
as a color or gray scale. The eye diagram accumulates data from all acquisitions until the Clear
Sweeps button is pressed, or any other acquisition parameter is changed, such as the bit rate,
samples/UI, number of samples, pattern length, etc. Note that this eye diagram differs from the one