Wave expert – Teledyne LeCroy WaveExpert 100H Operators Manual User Manual
Page 229
Wave Expert
WE-OM-E Rev A
227
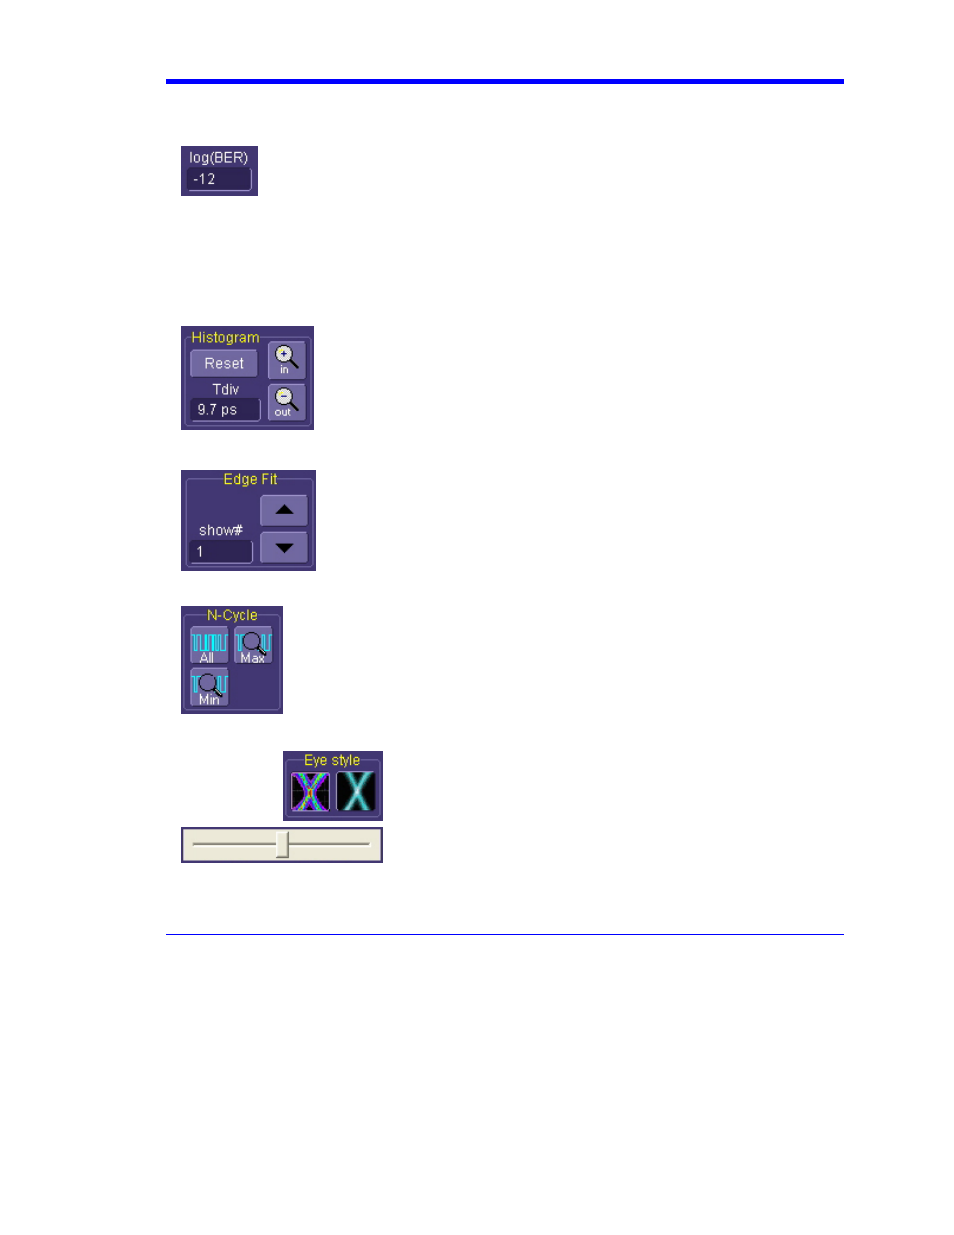
Log(BER)
The log(BER) control sets the desired bit error rate at which the total jitter is
measured. The control is scaled in powers of 10 so a value of -12, for example,
means a bit error rate of 10
-12
. The total jitter is measured by combining the
histograms from the random bounded and correlated jitter, using convolution.
The combined distribution is integrated to compute the cumulative density
function (CDF), which gives the total probability as a function of the
peak-to-peak jitter. The width of the CDF at a given probability is the total jitter,
and the probability is simply 1-BER where the BER is the bit error rate.
Histogram
The "Histogram" control group adjusts the scale of the Rj+BUj
histogram when a repeating pattern is being measured, or the scale of
the total jitter histogram when a random pattern is being measured. The
Reset button sets the horizontal scale to 10 ps/div while the zoom in
and zoom out controls adjust the scale in or out, in a 1-2-5 sequence.
The Tdiv control allows the scale to be set to any arbitrary value.
Edge Fit
The number in the "Edge Fit" show# control is the transition number,
starting with the first transition in the captured waveform. The actual UI
at which this transition occurs depends on the data pattern, since
consecutive “0” or “1” values will not have a transition. This control is not
available (grayed out) when the Edge Fit checkbox is unchecked.
N-Cycle
The "N-Cycle" group controls the zoom of the N-cycle jitter plot (DDj vs. bit).
Selecting All displays the entire bit pattern. Selecting Min or Max centers the
transition with the minimum or maximum data dependent jitter respectively,
and sets the scale to +/-10 UI on either side of this transition. The zoom
control is valuable when the data pattern is long and individual transitions
are difficult to see.
Eye Style
The eye pattern in the jitter display can be viewed either as a
color persistence map or as a gray-scale persistence map.
This control selects between the two. The color map makes it
easier to see very low probability events while the gray scale
image makes it easier to see underlying trends in the signal.
For example, it is often easier to view high noise signals in the
gray-scale format because the average value stands out
better.
The slide control adjusts the saturation level of the