Figure 12-1 . in-circuit debugger -2, Maxq610 user’s guide – Maxim Integrated MAXQ610 User Manual
Page 153
12-2
MAXQ610 User’s Guide
SECTION 12: IN-CIRCUIT DEBUG MODE
Flash-based MAXQ610 microcontroller devices are equipped with embedded debug hardware and embedded utility
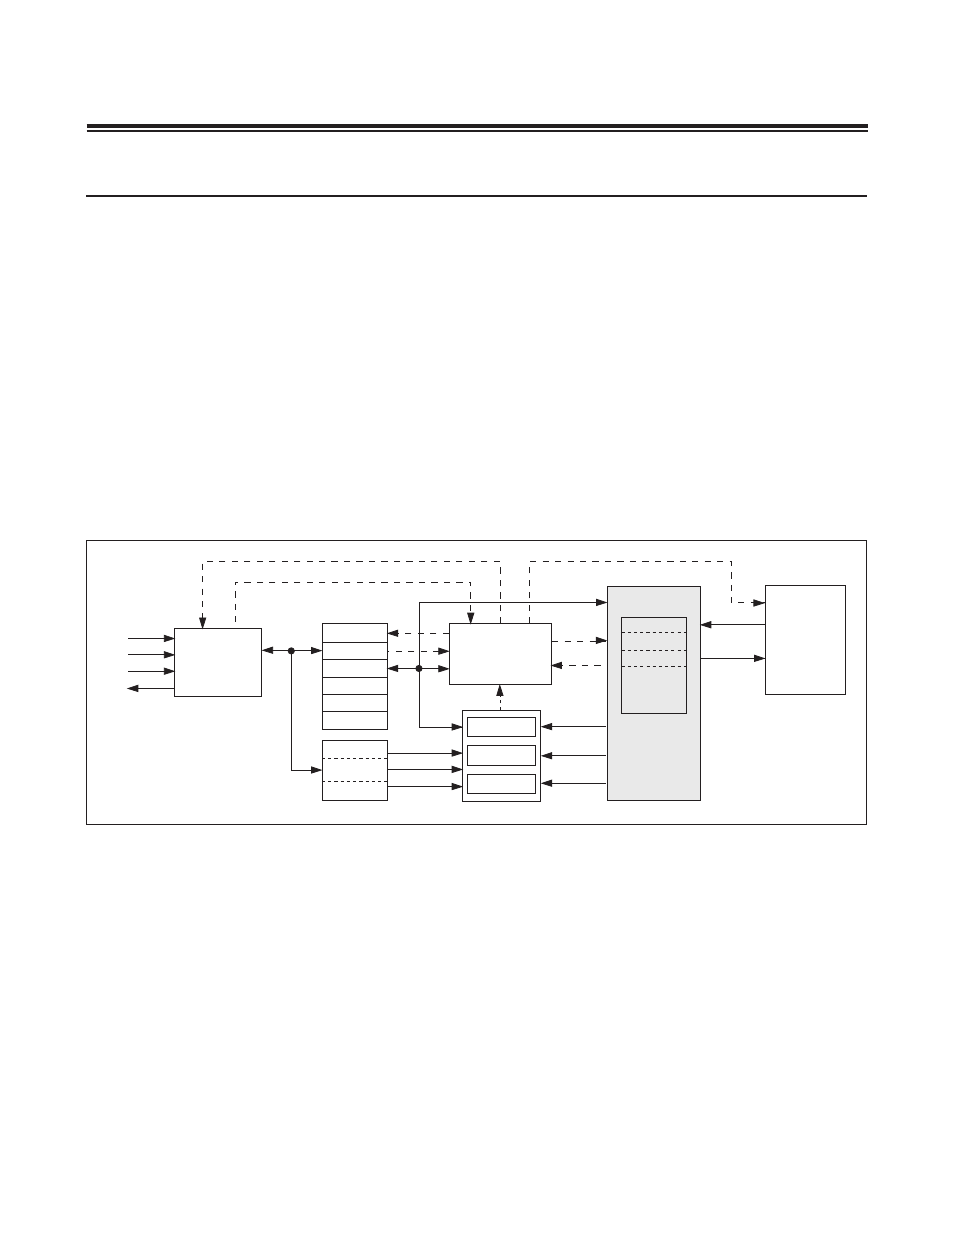
ROM firmware developed for the purpose of providing in-circuit debugging capability to the user application . The in-
circuit debug mode uses the JTAG-compatible TAP as its means of communication between the host and MAXQ610
microcontroller . Figure 12-1 shows a block diagram of the in-circuit debugger . The in-circuit debug hardware and
software features include the following:
• Debug engine
• Set of registers providing the ability to set breakpoints on register, code, or data
• Set of debug service routines stored in a utility ROM
Collectively, these hardware and software features allow two basic modes of in-circuit debugging:
• Background mode allows the host to configure and set up the in-circuit debugger while the CPU continues to
execute the normal program . Debug mode can be invoked from background mode .
• Debug mode allows the debug engine to take control of the CPU, providing read write access to internal registers
and memory, and single-step trace operation .
Note: The in-circuit debug peripheral registers ICDTn, ICDA, ICDB, ICDD, ICDC, and ICDF are used only by the utility
ROM . The user does not have access to these registers .
The embedded hardware debug engine is implemented as a stand-alone hardware block in the MAXQ610 micro-
controller . The debug engine can be enabled for monitoring internal activities and interacting with selected internal
registers while the CPU is executing user code . This capability allows the user to employ the embedded debug engine
to debug the actual system, in place of the in-circuit emulator, which uses external hardware to duplicate operation of
the microcontroller outside of the real application environment .
To enable a communication link between the host and the microcontroller debug engine, the debug instruction (010b)
must be loaded into the TAP instruction register using the IR-scan sequence . Once the instruction is latched in the
instruction parallel buffer (IR[2:0]) and is recognized by the TAP controller in the update-IR state, the 10-bit data shift
register is activated as the communication channel for DR-scan sequences . The TAP instruction register retains the
debug instruction until a new instruction is shifted through an IR-scan or the TAP controller returns to the test-logic-
reset state .
Figure 12-1. In-Circuit Debugger
TMS
TDO
TDI
TCK
CPU
ROM
DEBUG
ENGINE
BREAKPOINT
BREAK
ICDB
ICDF
ICDC
COMPARATOR
COMPARATOR
COMPARATOR
CODE ADDR
DATA ADDR
REG DATA
IP
IR
DATA
ADDR
ENABLE
ICDA
ICDD
ICDTn
TAP
CONTROLLER