Viewing the temperature graph, Viewing temperature sensor data – HP Integrated Lights-Out 4 User Manual
Page 153

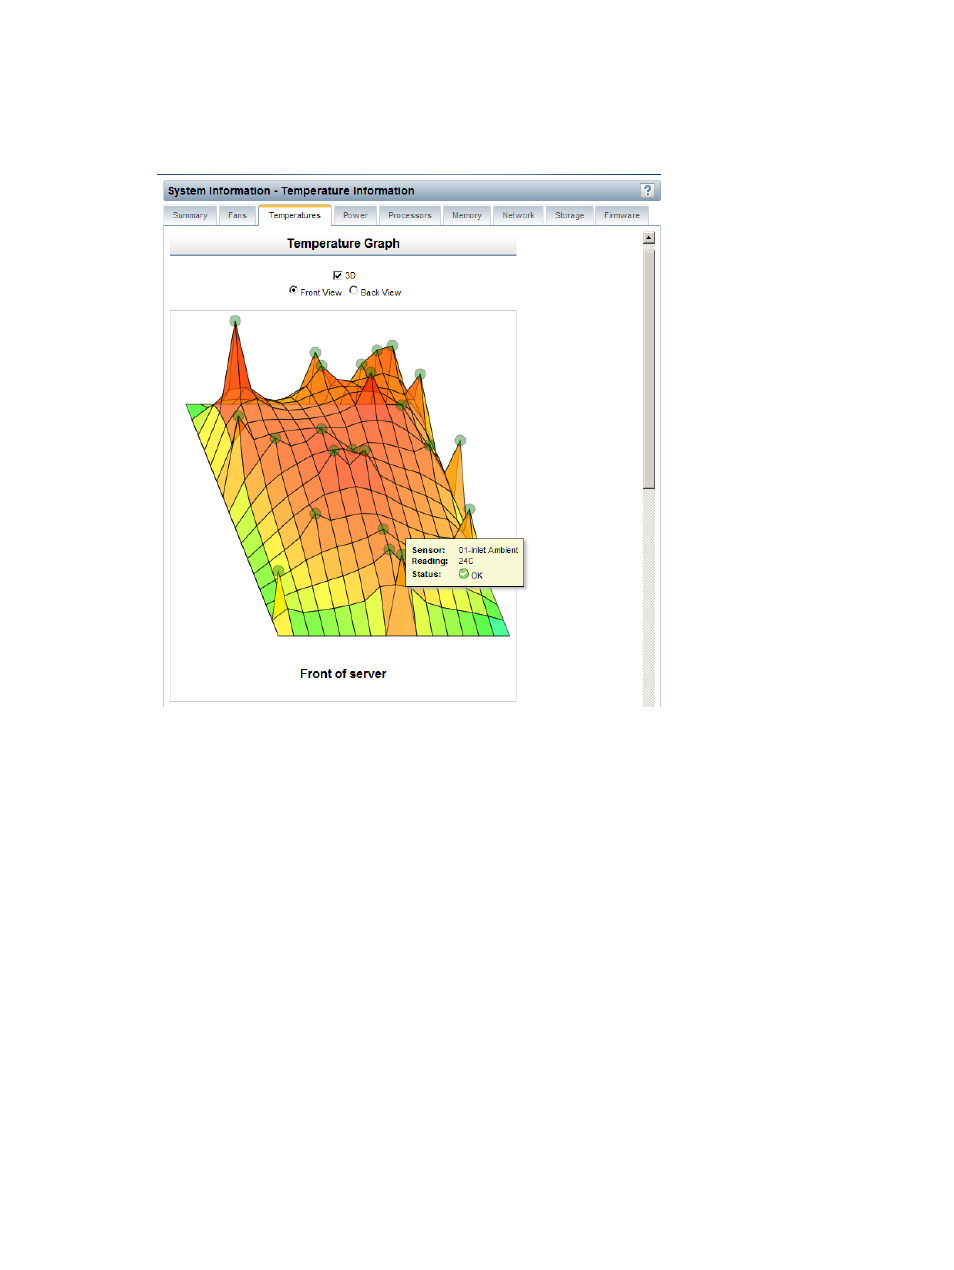
Viewing the temperature graph
To view the temperature graph, navigate to the Information
→System Information page, and then
click the Temperatures tab, as shown in
.
Figure 75 Viewing the temperature graph
Viewing the graph:
•
The circles on the graph correspond to the sensors listed in the Sensor Data table.
•
Move the mouse over a circle on the graph to view the sensor ID, status, and temperature
reading. For example,
shows sensor 01-Inlet Ambient on the temperature
graph and in the Sensor Data table.
•
The color on the graph is a gradient that ranges from green to red. Green represents a
temperature of 0°C and red represents the critical threshold. As the temperature of a sensor
increases, the graph color changes from green to amber, and then to red when the temperature
approaches the critical threshold.
Customizing the graph:
•
Select the 3D check box to display a three-dimensional graph.
•
Clear the 3D check box to display a two-dimensional graph.
•
Select Front View or Back View to display the sensors located at the front or back of the server.
Viewing temperature sensor data
To view temperature sensor data, navigate to the Information
→System Information page, and then
click the Temperatures tab, as shown in
Viewing iLO system information
153
