Dashboard – HP P6000 Performance Advisor Software User Manual
Page 19
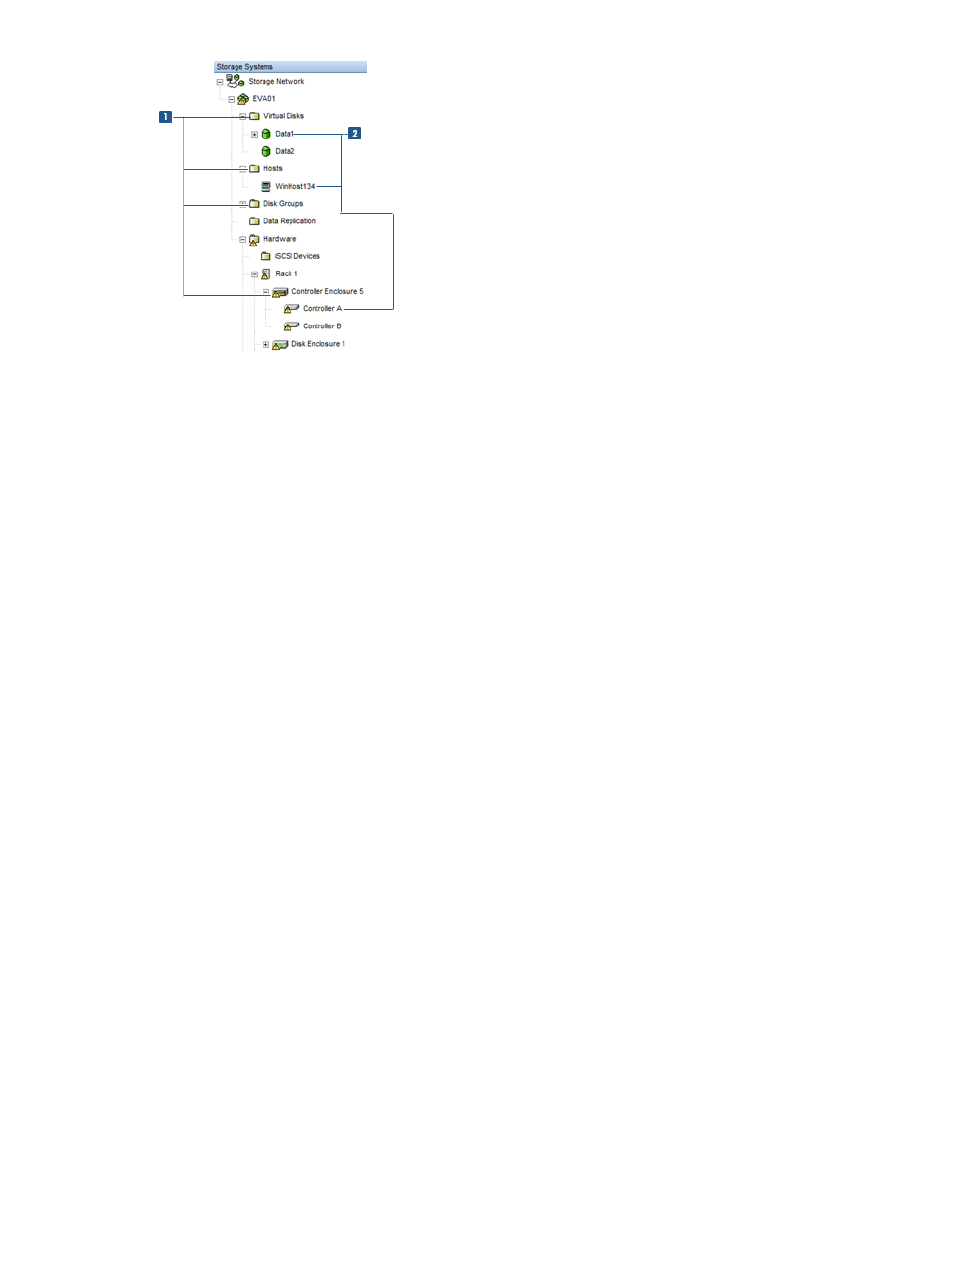
2 Storage object nodes
1 Object type folder nodes
States for storage objects in HP P6000 Performance Advisor
The storage objects in HP P6000 Performance Advisor can belong to one of the following states:
•
Monitored. Storage object is actively monitored by HP P6000 Performance Advisor and
performance data for the object is available for you to view.
•
Not Monitored. Storage object is not being monitored for performance data. In this case, the
object must be added for monitoring in HP P6000 Performance Advisor.
•
Cannot be Monitored. Storage object is not supported for monitoring in HP P6000 Performance
Advisor. This state is valid for ungrouped disks and hardware objects, such as disk enclosures,
disk drives, and racks.
Dashboard
Dashboard provides a quick view of the overall performance of a storage system and includes the
live bar-chart and historical throughput and latency values of the storage system. The Major and
Minor threshold vales are taken from the selected dashboard profile. If no dashboard profile is
selected, the threshold values will not be displayed. These threshold values are the reference points
for the live data samples and help you analyze the total I/Os processed in per unit time and
duration taken to complete each request (latency). New dashboard profiles can be created by
using the Click to create Dashboard profile. Dashboard configuration can also be changed by
clicking the Dashboard configuration link.
In addition, the following data is also included as part of the dashboard data:
•
Storage system related charts for the selected duration, includes the Threshold Summary chart,
Host Port IOPS Historical chart, and Host Port IO Latencies chart.
The Threshold Summary chart provides the overall threshold summary of threshold monitored
objects. It includes a summary of the current total threshold-monitored objects for every object
type.
•
Key Performance Indicators, includes historical performance chart along with statistical data.
The live bar-chart is constantly refreshed at five-second intervals in Dashboard. You can drill down
to each controller and host port performance data to view live bar-chart and historical data for
controllers and host ports associated with the storage system, and determine which component is
under the maximum load. While displaying controller level data, minor and major throughput
values are automatically considered half of what is set for the storage system. For more information,
see
“Viewing the Dashboard Overview” (page 90)
.
Dashboard
19