Understanding a live bar chart, Storage system level performance charts, Storage system level performance – HP P6000 Performance Advisor Software User Manual
Page 94

NOTE:
Even if the performance exceeds the Major threshold level, the color in the status bar
shows orange.
Understanding a live bar chart
Interpret the live bar chart in
as follows:
•
Total Read Req/s counter:
The 2000 and 3000 values are the minor and major threshold levels set for the Total
Read Req/s counter.
◦
◦
The 4064 value indicates the total read requests processed by all the host ports so far
have crossed the major threshold level. The storage system is handling high read requests
and needs immediate attention.
◦
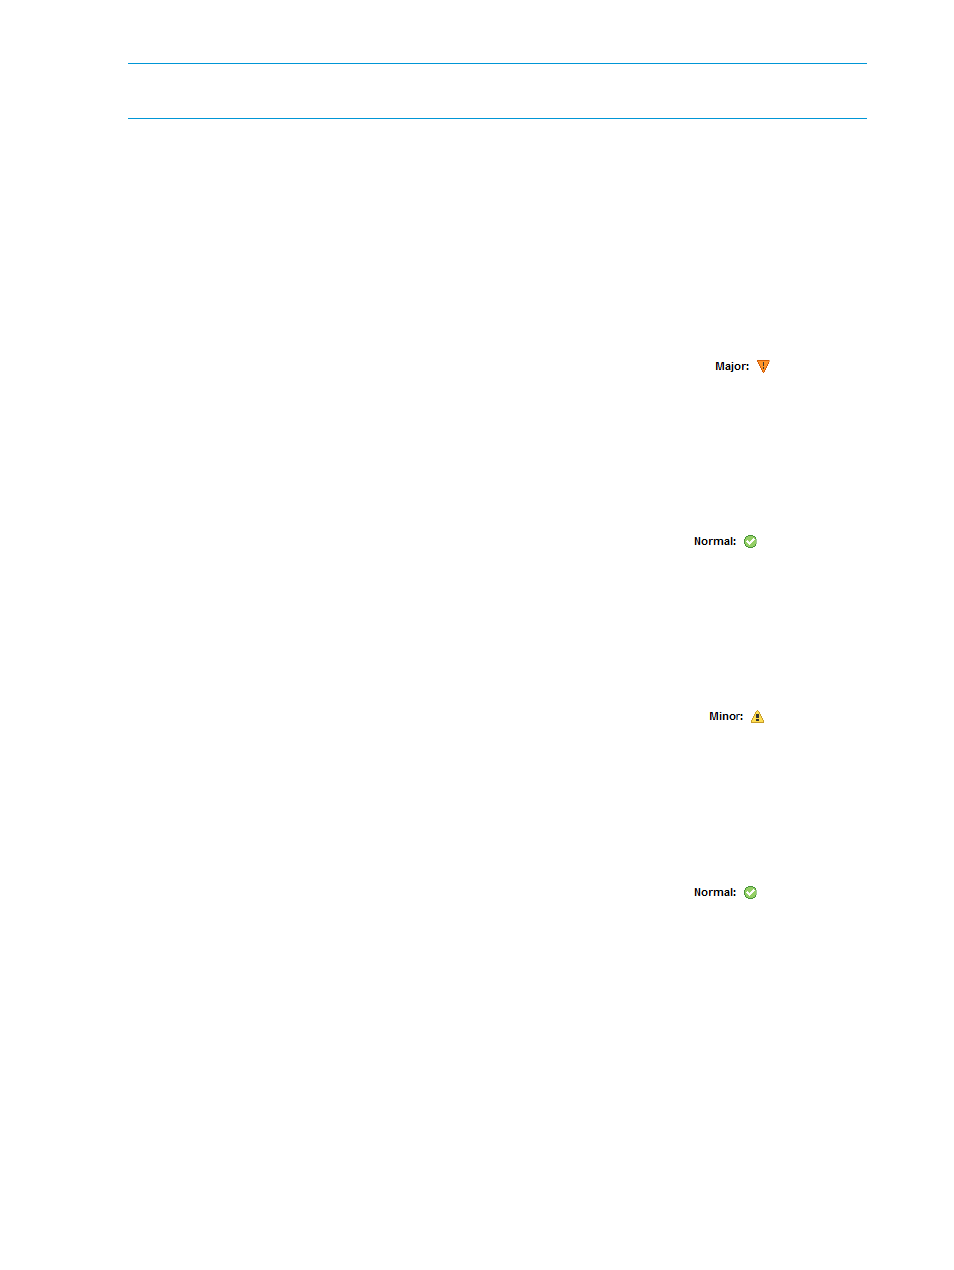
The status bar shows an orange color block, which correlates to the
state.
•
Average Read Latency (ms) counter:
The 2 and 5 values are the minor and major threshold levels set for the Average Read
Latency (ms) counter.
◦
◦
The 0.72 value indicates the average read latency observed on all the host ports so far
are within the minor threshold level.
◦
The status bar shows a green color block, which correlates to the
state.
•
Total Write Req/s counter:
The 2000 and 5000 values are the minor and major threshold levels set for the Total
Write Req/s counter.
◦
◦
The 2016 value indicates the total write requests processed by all the host ports so far
have crossed the minor threshold level, but is still within the major threshold level.
◦
The status bar shows an yellow color block, which correlates to the
.
•
Average Write Latency (ms) counter:
The 2 and 5 values are the minor and major threshold levels set for the Average Write
Latency (ms) counter.
◦
◦
The 1.16 value indicates the average write latency observed on all the host ports so far
are within the minor threshold level.
◦
The status bar shows a green color block, which correlates to the
state.
Storage System level performance charts
By default, this section of the Dashboard Overview tab displays the following performance charts
for the duration that you selected under the Dashboard Settings tab (see
):
•
Host Port IOPS Historical chart
•
Host Port IO Latencies chart
•
Threshold Summary chart (default)
Procedure
To view a storage system level performance chart for a different duration:
1.
Select the performance chart that you want to view from the View list and click OK.
94
Working with HP P6000 Performance Advisor
