Live data metrics, Historical data metrics, Live data metrics historical data metrics – HP P6000 Performance Advisor Software User Manual
Page 25

Live Data Metrics
The Live Data Metrics are taken from the latest sample and include the following:
•
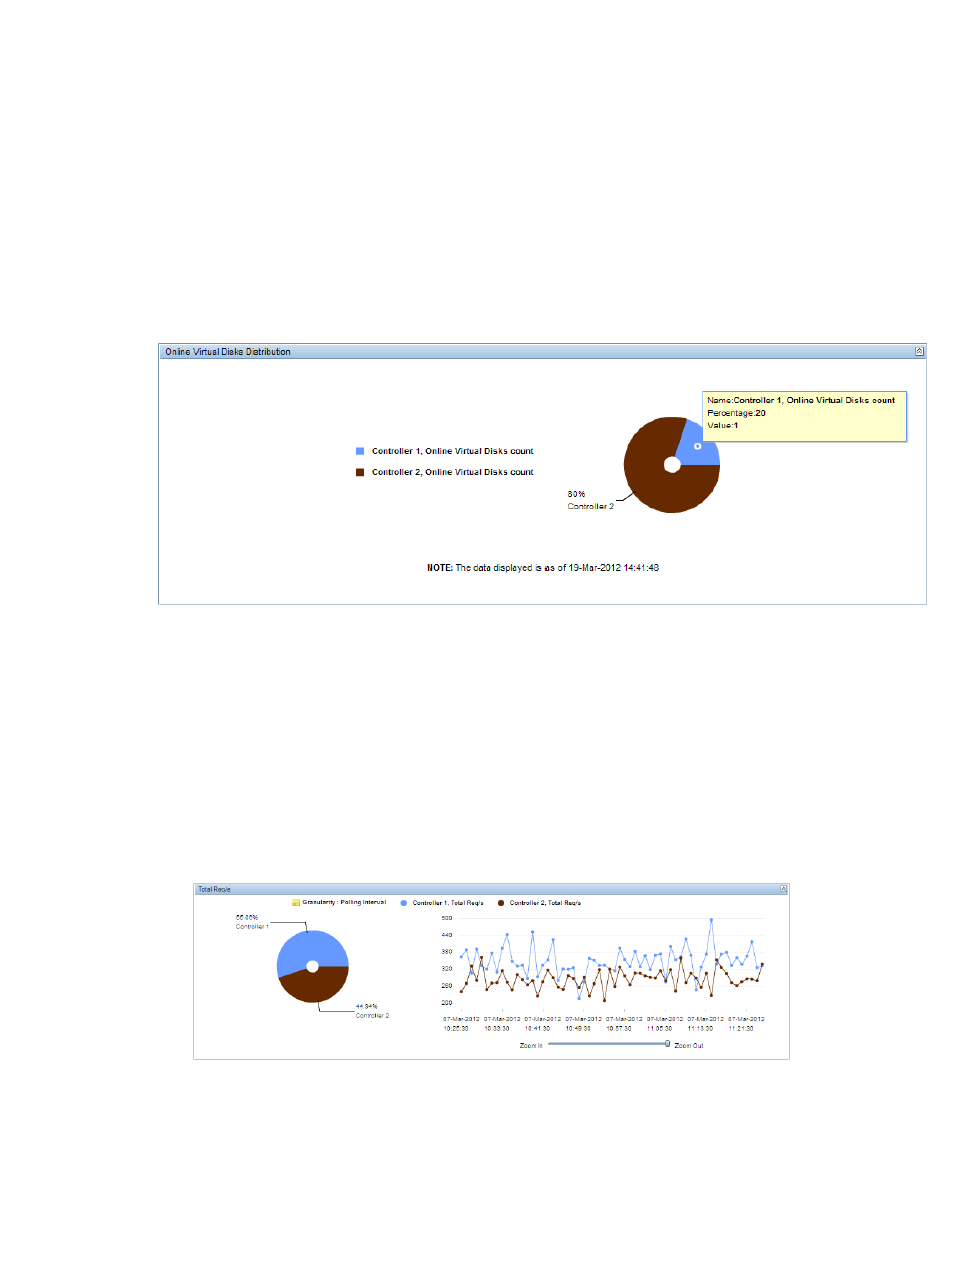
Online Virtual Disks Distribution
For a particular controller, this calculated metric records the number of virtual disks that satisfy
the following criteria:
◦
The virtual disk is owned by this controller
◦
The virtual disk is presented to at least one host
◦
The virtual disk is not presented to any host but part of a Data Replication Group
Figure 1 Online virtual disks distribution for storage system
Historical Data Metrics
The Historical Data Metrics enable you to select the time duration and view the performance data
collected within that time duration. Apart from the default time duration of 1, 6, 12, or 24 hours,
you can also retrieve information for any custom duration of 24 hours.
The historical data metrics include the following:
•
Total Req/s
For each controller, this metric records the total I/O requests received by this controller during
the current sample interval. It includes all read requests regardless of whether they resulted in
a cache hit or a cache miss, and all write requests. It also includes data writes caused by
transfers from a source DRM system to this system for data replication.
•
Total MB/s
For each Controller, this calculated counter records the sum of total data rate on each virtual
disk, owned by this controller during the current sample interval. This includes all the read
requests (includes I/O from hosts and data reads caused by a DRM initial copy to a remote
CA system regardless of whether they resulted in a cache-hit or a cache miss) and all the write
Load Distribution
25
