HP P6000 Performance Advisor Software User Manual
Page 92
Select Dashboard profile drop-down lists the dashboard profiles associated with the controller
model. Based on the dashboard profile linked to the selected storage system, Major and Minor
threshold levels are displayed. It is possible to select a different dashboard profile from the Select
Dashboard Profile drop-down list and view the live Host Port Throughput and Latency Values at a
particular instant of time. The selected dashboard profile is not saved.
The threshold values you specify are used to monitor the performance of each host port in the
storage system. The threshold values also appear as reference points in the live bar-chart and help
you analyze if the live data sample shown for a specific dashboard counter is within or exceeded
the specified threshold limit. If minor and major threshold levels are not configured, a grey status
bar with the current performance value in the center is displayed. For more information on
configuring dashboard threshold levels, see
“Configuring dashboard settings” (page 62)
.
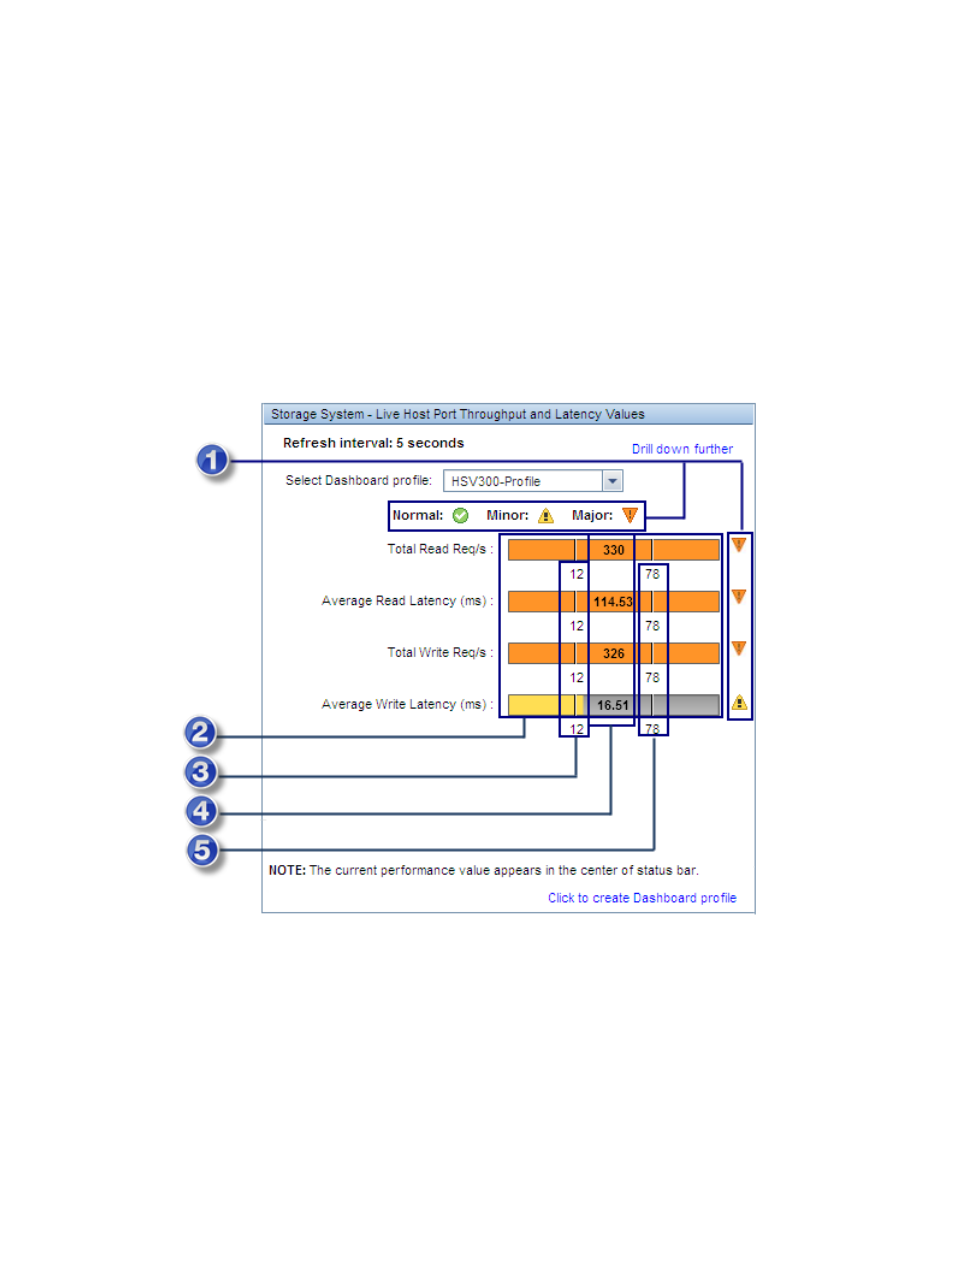
The following example shows the dashboard live bar chart for a storage system:
Figure 2 Live bar chart
3 Minor threshold level
2 Status bar showing color blocks
1 States and status icons
5 Major threshold level
4 Current performance data sample
92
Working with HP P6000 Performance Advisor