Threshold summary for a performance object, Threshold, Threshold summary for a performance – HP P6000 Performance Advisor Software User Manual
Page 106: Interpretation of the

Interpretation of the threshold summary – object type
Interpret the threshold summary data in
as follows:
•
The threshold summary is based on the performance data collector over the last hour for the
Virtual Disks object type.
•
The virtual disk counters and the status icons are the column headers.
•
Each virtual disk record appears in a separate row.
•
The threshold summary value is 100% for the first virtual disk record for all the counters except
for Total Read MB/s and it is under the
status icon. This means that for 100% of the last
hour, all the performance data samples of the virtual disk for all the counters except for the
Total Read MB/s counter were within the minor threshold level.
•
The threshold values are 57% and 43% for the first virtual disk record for the Total Read MB/s
counter and are under the
and
status icons respectively. This means that for 57% of the
last hour, all the performance data samples of the virtual disk for the Total Read MB/s counter
were within the minor threshold level, and for 43% of the last hour, all the performance data
samples of the virtual disk for the Total Read MB/s counter crossed the minor threshold level
but were still within the major threshold level.
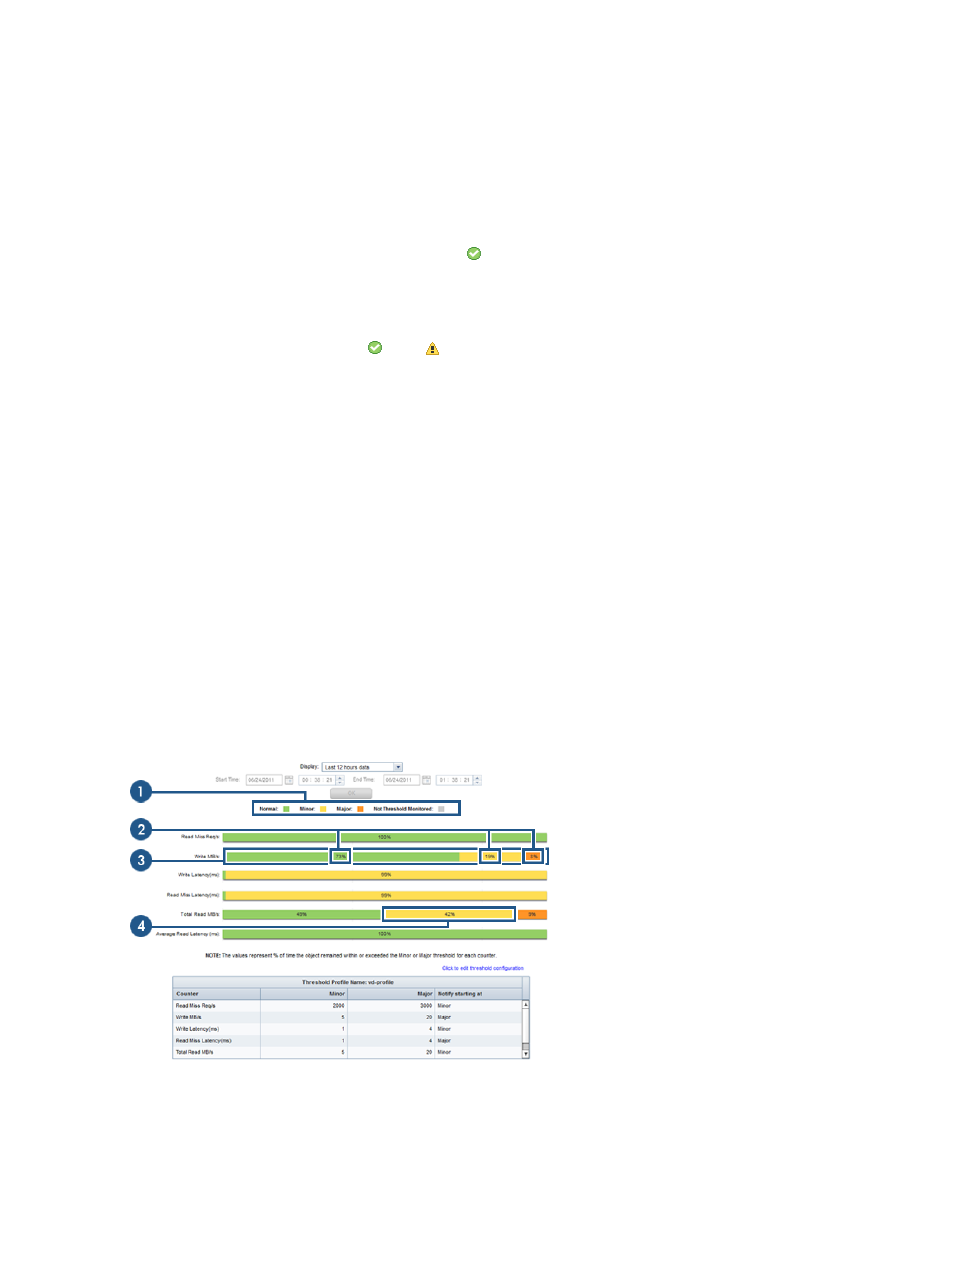
Threshold summary for a performance object
The threshold summary for a performance object provides the threshold summary values for the
selected duration. For more information on threshold summary value, see
. Threshold monitoring status bars are displayed for all those counters for which
the performance object is threshold monitored during the selected duration. Different color blocks
are displayed in the threshold monitoring status bars based on the threshold values of the
performance object. Each color block identifies with the appropriate state for the performance
object. In addition, details of the associated threshold profile are displayed in the threshold summary
table below the threshold monitoring status bars. For more information, see
The following example shows the threshold summary for a virtual disk:
Figure 5 Threshold summary for performance objects
2 Threshold values
1 Status icons and states
4 Color block
3 Threshold monitoring status bar
Move the pointing device over the threshold monitoring status bar to view the tool tip data. See
“Understanding tool tip” (page 104)
106 Working with HP P6000 Performance Advisor
