Understanding tool tip, Threshold summary for an object type, Threshold summary for – HP P6000 Performance Advisor Software User Manual
Page 104: Interpretation of the threshold

edit the configured threshold settings. For more information, see
NOTE:
If the storage system has not been threshold monitored during the duration selected
as the custom duration, an error message is displayed and a gray chart appears. So, select
a duration when the storage system has been threshold monitored.
Understanding tool tip
Move the pointing device over the threshold monitoring status bars to view information about the
status:
•
Status: The current state of the storage system
•
Counter: The counter for which the storage system is threshold monitored
•
Percent: The threshold summary value corresponding to the specific state
If the storage system is not threshold monitored for the selected duration, the threshold monitoring
status bar is gray and the tool tip shows Not threshold monitored.
Interpretation of the threshold summary – Storage system
Interpret the threshold summary data in
as follows:
The threshold summary is based on the performance data collected over the last hour. The threshold
profile is Array–TP–Profile.
•
For the Total Host Req/s counter:
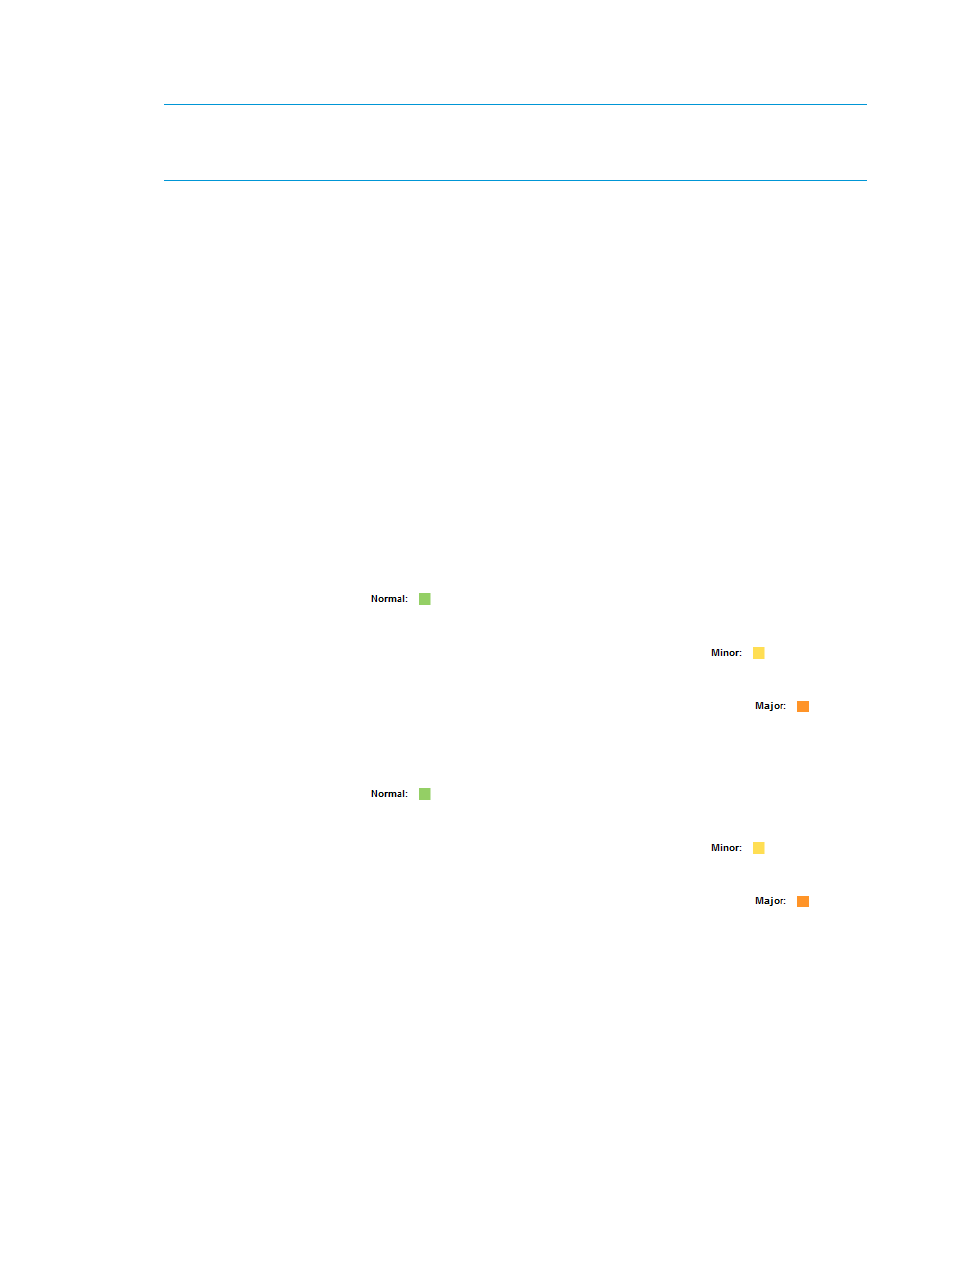
For 50% of the last hour, all the performance data samples were within the minor threshold
level, identified by the
state.
◦
◦
For 13% of the last hour, all the performance data samples exceeded the minor threshold
level but were still within the major threshold level, identified by the
state.
◦
For 37% of the last hour, all the performance data samples exceeded the major threshold
level and the storage system needs immediate attention, identified by the
state.
•
For the Total Host MB/s counter:
For 30% of the last hour, all the performance data samples were within the minor threshold
level, identified by the
state.
◦
◦
For 33% of the last hour, all the performance data samples exceeded the minor threshold
level but were still within the major threshold level, identified by the
state.
◦
For 37% of the last hour, all the performance data samples exceeded the major threshold
level and the storage system needs immediate attention, identified by the
state.
Threshold summary for an object type
The threshold summary for an object type includes the summary of all corresponding performance
objects for the selected duration. The summary includes the threshold values of each performance
object for different monitored counters. The threshold summary value signifies the percentage of
time an object remained at a specific state for that counter. For more information on threshold
summary value, see
“Threshold summary value” (page 35)
For more information on the counters supported for threshold monitoring, see
.
The counters and performance objects appear in the column-row format in the threshold summary
table. The counters are column headers for the object type and the status icons representing the
three different states (Normal, Minor, and Major). Each row is a performance object record. The
threshold summary values for each counter appears under the status icon that indicates the state
104 Working with HP P6000 Performance Advisor
