Threshold summary value – HP P6000 Performance Advisor Software User Manual
Page 35
IMPORTANT:
•
Threshold monitoring is not supported for physical disks and data replication tunnels.
•
If a performance object or storage system is removed from threshold monitoring in HP P6000
Performance Advisor, its threshold summary data until the time of deletion is still available.
•
In the dashboard displayed for a storage system, the threshold summary chart values represent
the number of performance objects whose performance is within or exceeded the threshold
levels for any threshold monitored counter.
•
Threshold levels are applied on Log Full % reported by only the controller associated with the
data replication groups. Threshold levels are not applied on the controller that is not associated,
as that controller always reports zero (0) value.
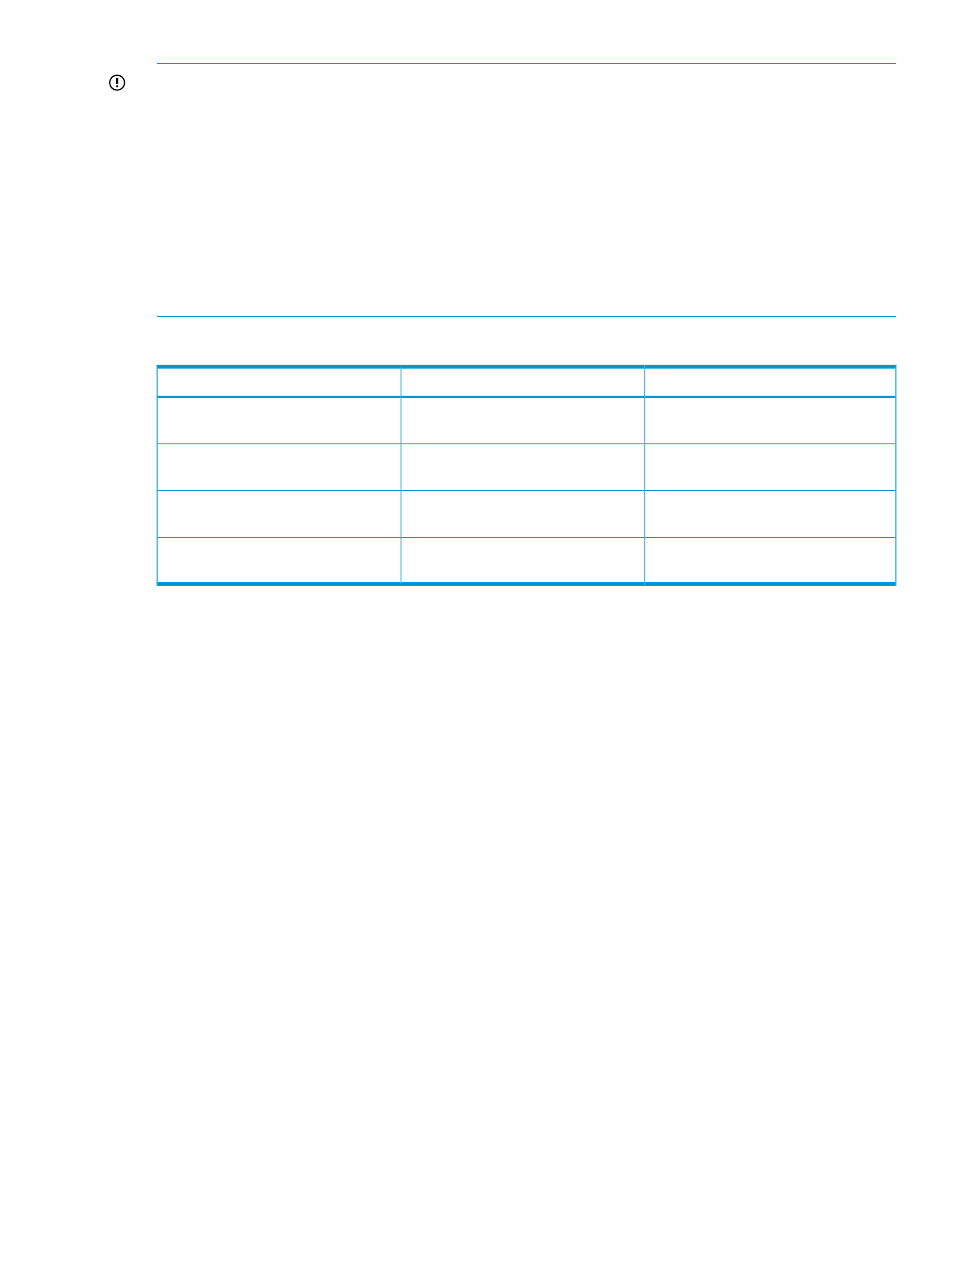
The following color icons indicate the state of a storage system or performance object:
Description
State
Status icons
Performance is within the minor
threshold level.
Normal
Green
Performance is at or above the minor
threshold level.
Minor
Yellow
Performance is at or above the major
threshold level.
Major
Red
Storage system or performance object
is not threshold monitored.
Not threshold monitored
Gray
The threshold summary is considered only for the threshold monitored duration. For example, if a
performance object is threshold monitored since the last two hours and the duration selected to
view threshold summary is last six hours, the threshold data across the last two hours is only
displayed for the selected duration. The threshold state of the object is also based on the threshold
data in the last two hours.
If performance data collection stops when threshold monitoring is in progress, the last known
threshold state (Major/Minor/Normal) is shown for the duration that you select. It is valid until the
time the performance data collection resumes. For example, consider the following scenario:
1.
A performance object is threshold monitored from 8:00 am.
2.
The performance of the object crosses the Major threshold level for that counter at 8:30 am.
3.
At the same time, the performance data collection for the object stops.
In such a case, if you view threshold summary for the object from 9:00 am - 12:00 pm, the threshold
data collected till 8:30 am is only displayed. The performance data collection stopped, the threshold
data collected until the time the performance data collection was in progress is only shown. Also,
the state of the performance object is shown as Major and identified by the Orange color code
in the threshold summary.
You can configure email and SNMP notification that are generated when the performance data
of an object reaches or exceeds threshold levels. You can also configure notifications to be sent
if the performance of an object drops below the set threshold levels. Apart from email and SNMP
alerts, events are generated by default.
Threshold summary value
The duration you select to view the threshold summary is depicted on a scale of 0 to 100%. The
duration for which a performance object reaches, exceeds, or drops below a threshold level is
Threshold monitoring
35