Viewing records for a state – HP P6000 Performance Advisor Software User Manual
Page 105

of the performance object. In addition, you can view all performance object records whose
performance for at least one monitored counter belongs to a specific state. For more information,
see
“Viewing records for a state” (page 105)
. If a performance object is not threshold monitored
for a counter during the selected duration, a hyphen (-) appears for that performance object record
under the respective counter column headings.
You can also filter the performance object records based on parameters specific to the selected
object type, see
“Filtering records for object types” (page 111)
Click the link for each performance object record to view the threshold summary for that object.
For more information, see
“Threshold summary for a performance object” (page 106)
IMPORTANT:
In case of the following, view threshold summary is segregated for counters based on the specific
object type to which they belong:
•
Disk group: Virtual Disk Group (default), Physical Disk Group
•
Controller: Individual controller (default) and associated host ports
For an individual controller, the threshold summary will be an aggregate of all the associated
host ports
•
If you threshold monitor a host, the threshold summary value is derived as the aggregate of
the respective host connections.
Select the above mentioned from the Display counters for drop down list and click OK on the
respective threshold summary pages.
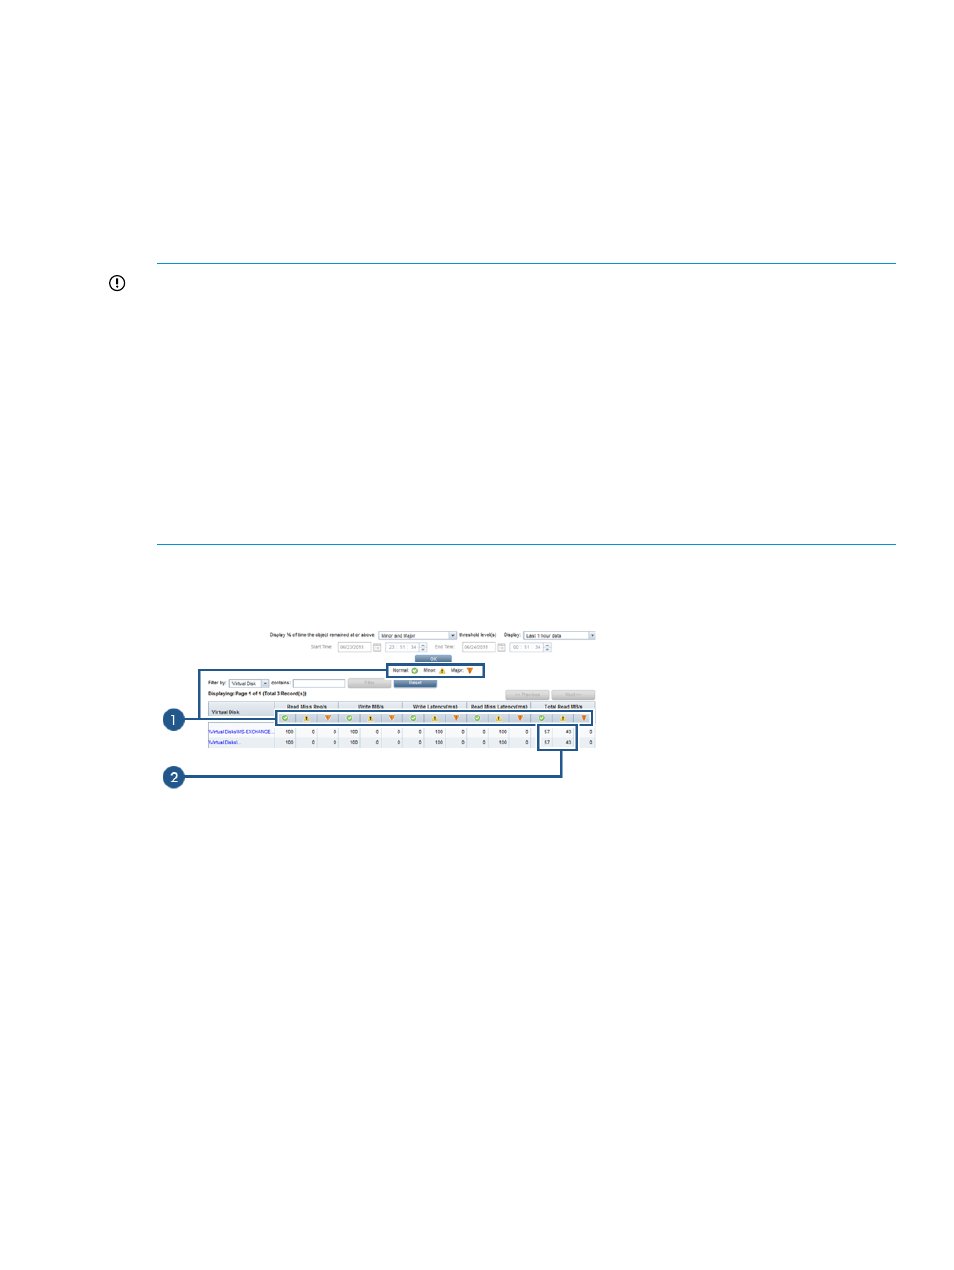
The following example shows the threshold summary for a Virtual Disk object type:
Figure 4 Threshold summary for an object type
2 Threshold value of each threshold monitored performance
object
1 Status icons and states (Normal, Minor, and Major)
For more information about the threshold summary for an object type, see
threshold summary – object type” (page 106)
Viewing records for a state
You can filter the performance object records to view only those records in a specific state or
combination of states during the selection duration. Following are the different available states:
•
All (Normal, Minor, and Major)
•
Minor and Major
•
Minor
•
Major
Select one of these options from the Display % of time the object remained at or above list and
click OK. The threshold summary table is updated to list only those performance object records
that match the selected criteria.
Viewing performance metrics of storage systems 105
