Teledyne LeCroy Sierra M6-1 SAS_SATA Protocol Analyzer User Manual User Manual
Page 44
Teledyne LeCroy
Start Recording
42
Sierra M6‐1 SAS/SATA Protocol Analyzer User Manual
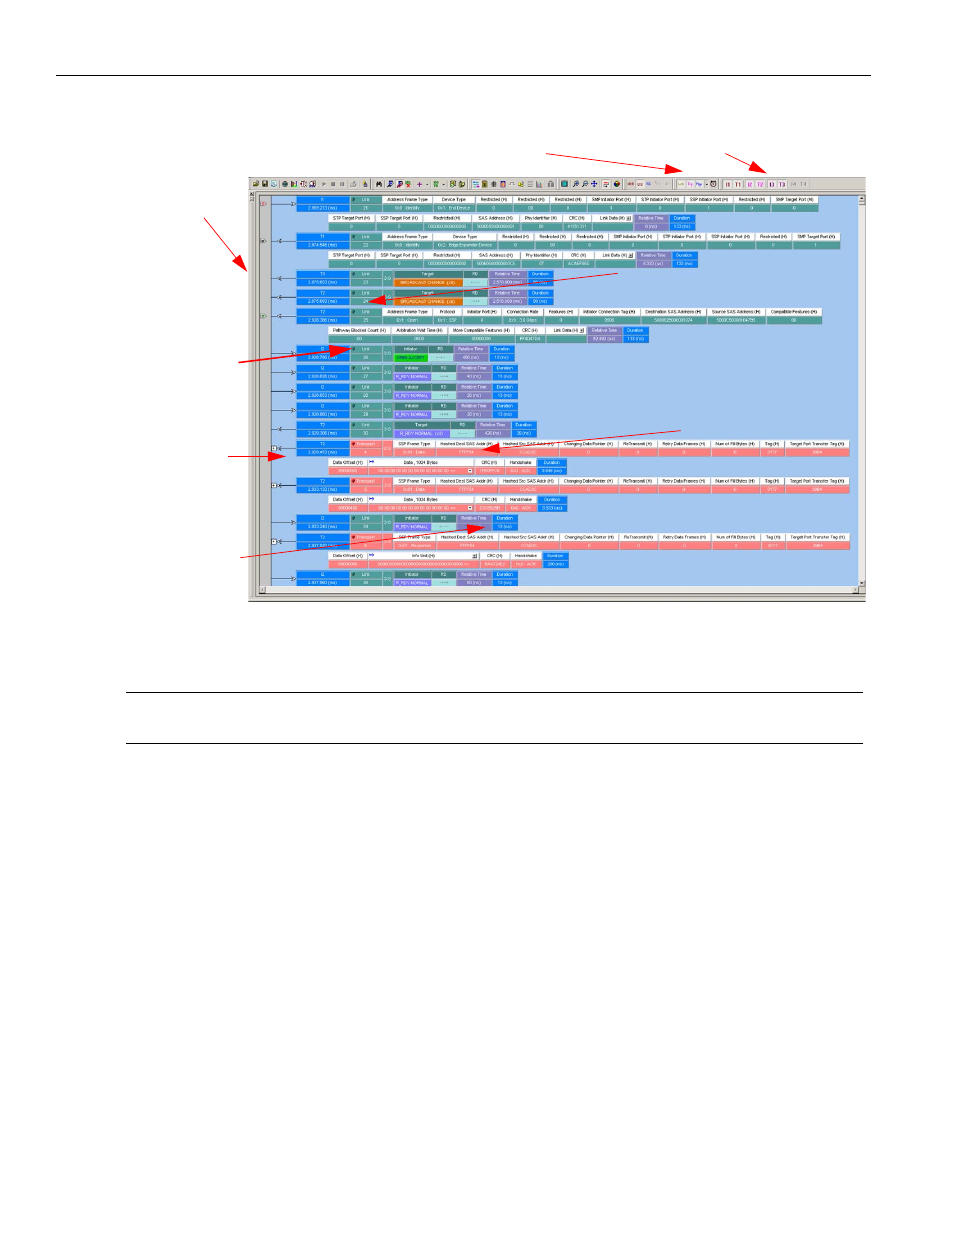
Figure 2.5: SAS: Typical Packet View
Note:
When using the Advanced Mode sequencer, the analyzer logs the state transitions in the trace,
with the name the user gives to the state.
In the Packet View, right‐click on any packet and select Show‐>State, to display the states
and their transitions in the trace.
SAS: In case of an STP interface, the expander displays STP addresses provided to the
SATA drive and the SAS software integrates the STP addresses in the ATA command.
The results display shows each transaction for every layer identified in a different color
and the data direction identified with data direction arrows. Upstream traffic has an
arrow from right to left:. Downstream traffic has an arrow left to right: .
Layers can be hidden by clicking the corresponding Show/Hide button on the menu bar.
The system retains all captured data, but the display has fewer data layers for simpler
viewing.
You can configure the viewer display for test and viewing preferences (see
for details about configuring the viewer display).
Layer ID with different colors
Data direction arrows
X,Y,T
Cursors
Show/Hide Layers buttons
Source and destination addresses in SCSI commands
Transport Layer command interpretation
not shown in this capture
Show/Hide Port Data
Link
Layer
Relative time display
(between two sequential
packets on the same
layer and port)