Expanded waveform view, 10 statistical report, Generating statistical read/write report – Teledyne LeCroy Sierra M6-1 SAS_SATA Protocol Analyzer User Manual User Manual
Page 127
Sierra M6‐1 SAS/SATA Protocol Analyzer User Manual
125
Analysis
Teledyne LeCroy
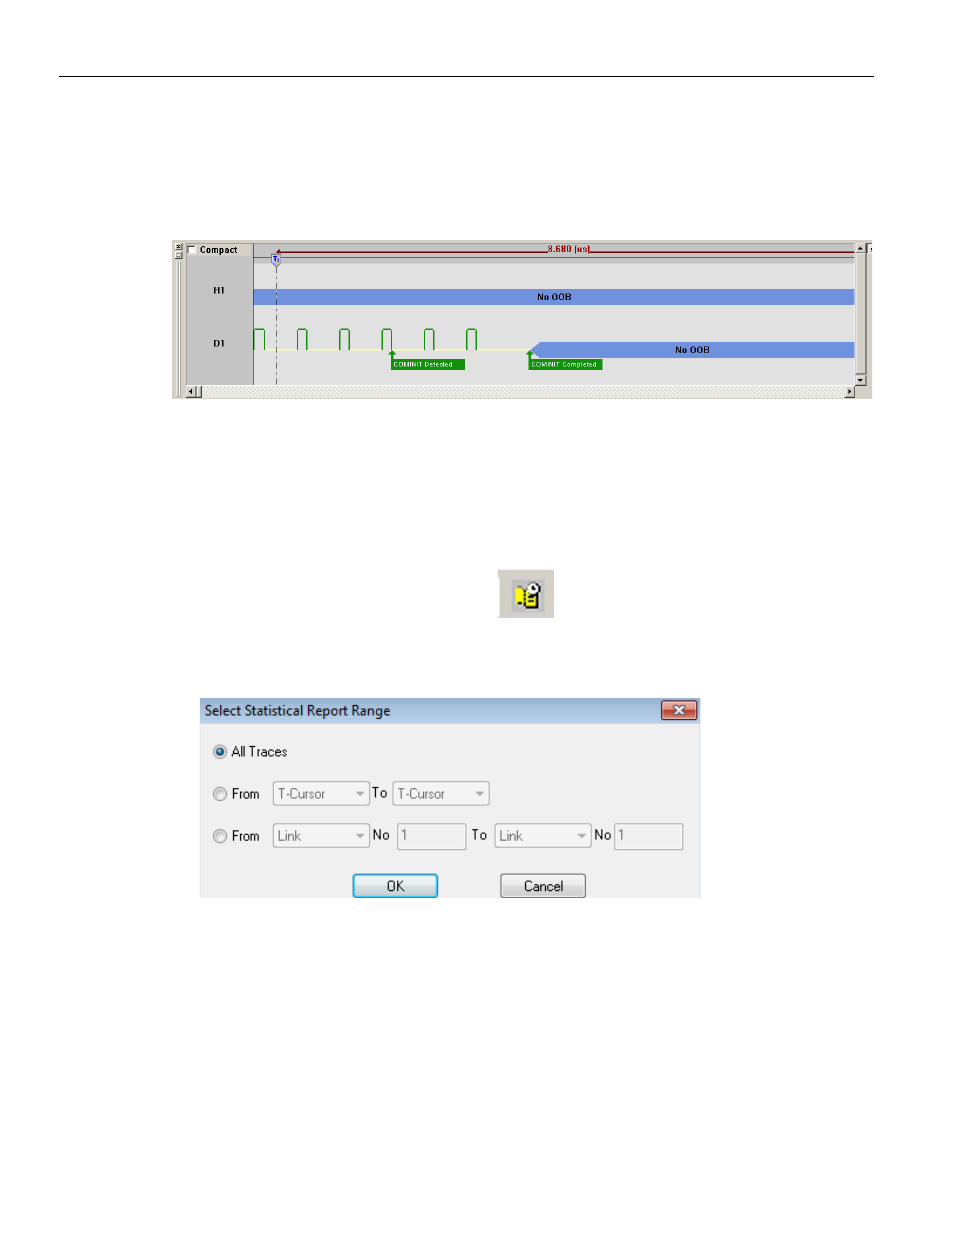
Expanded Waveform View
To see a 10x time scale expansion of the waveform, uncheck the Compact View checkbox
in the Waveform View window. The OOB Sequence has speed negotiation (Hardware
version 4 or later).
Figure 3.21: SATA: Expanded Waveform View
3.3.10
Statistical Report
Whenever a captured sample is in the Sample Viewer, a Statistical Report selection in the
Report menu and a Statistical Report Button on the viewer toolbar are enabled. You can
create a Statistical Report for the entire capture or select a portion of it.
To display a Statistical Report, click the
Statistical Report button on the viewer
toolbar or select Analysis > Statistical Report to display the Select Statistical Report
Range dialog.
Figure 3.22: Statistical Report Range Dialog
The default statistical report has All Samples. You can set a specific Statistical report range
between defined cursor positions or events.
Generating Statistical Read/Write Report
To create a statistical read/write page perform the following steps:
1. Click on the Setup menu option and select Preferences.
2. Click on the Trace Viewer tab.
3. Check the box Create statistical report read/write page (see
).