Viewing captured data – Teledyne LeCroy Sierra M6-1 SAS_SATA Protocol Analyzer User Manual User Manual
Page 32
Teledyne LeCroy
Teledyne LeCroy SAS/SATA Protocol Suite Menu Options and Toolbars
30
Sierra M6‐1 SAS/SATA Protocol Analyzer User Manual
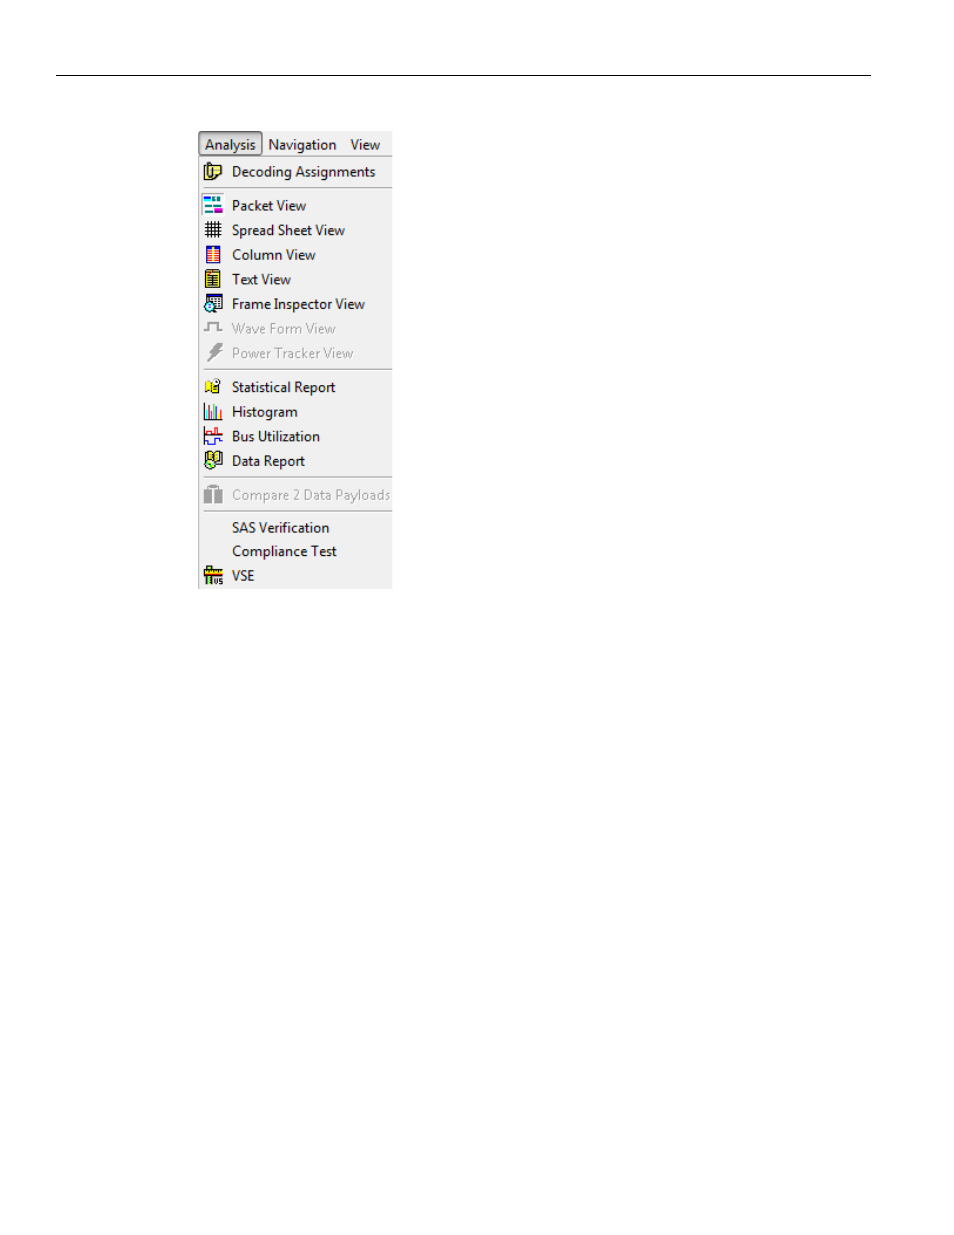
Figure 1.20: SAS/SATA Analysis Menu
Viewing Captured Data
Captured data can be displayed in several views. Select Analysis from the drop‐down
menu to access the different views (see
). You can display the
same data in:
Packet View: Displays packets
Spreadsheet View: Displays Packet View fields by time
Column View: Shows DWORDs in columns by port
Text View: Shows transaction frames, grouped in columns by port
Frame Inspector View: Has lots of information that is available in Packet View,
but not Spreadsheet View, so it is most useful in conjunction with the Spread‐
sheet View.
Waveform View: Shows waveform display for all active ports, on which you can
perform timing measurements
Statistical Report: Generate statistics for all transports, commands, primitives,
bus conditions, addresses, lanes, and errors
Histogram View: Shows frame‐type transfers
Bus Utilization: Displays the utilization of the bus
Data Reports: Displays data payloads
Compare 2 Data Payloads: Compares 2 data payloads
SAS Verification: Verifies compliance with the SAS specification
Compliance Test: Verifies compliance with the SATA specification
VSE: Perform custom post‐process analysis of the open trace by running a verifi‐
cation script over the trace