Diagnostic settings page – Interlogix Topaz User Manual User Manual
Page 113

Chapter 5
Control
95
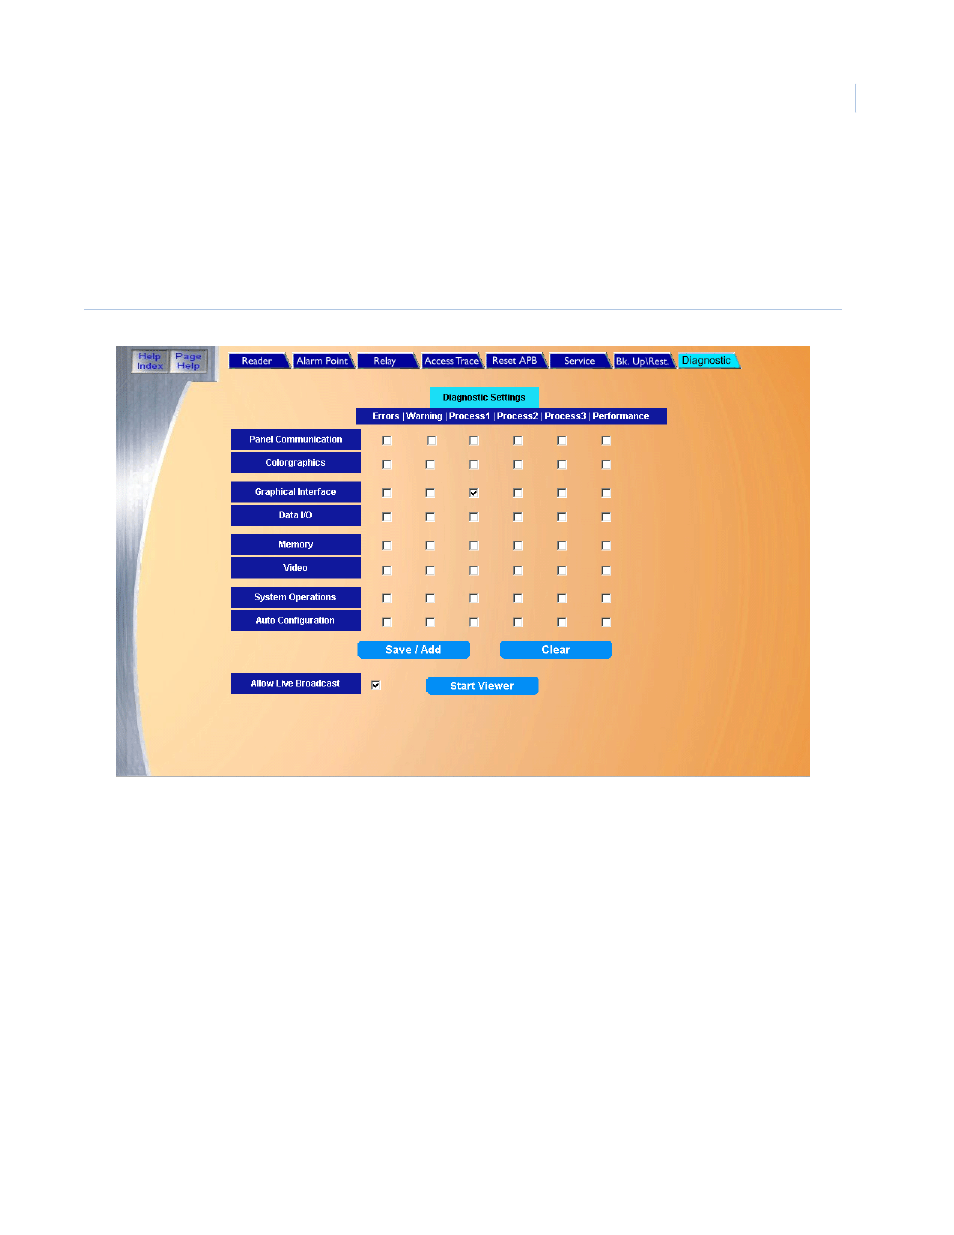
Diagnostic Settings Page
The Diagnostic Settings page allows the operator to define what kind of information about the Topaz
system is recorded. To navigate to the Diagnostic Settings page, from any page within the Control
pages click the Diagnostic tab at the top of the screen, or from the main browser window click on the
Diagnostic button on the right side of the screen. The following page displays.
Figure 68.Diagnostic Settings page
The main portion of the Diagnostic Settings page consists of check boxes arranged in columns,
which represent the level of diagnostic logging requested; and rows, which represent a logical
function to be logged.
The columns function as follows:
•
Errors: Checking this column records those items that the software considers a real problem.
For example, ‘File Not Found’ after being requested to get a cardholder’s photo would be an
error.
•
Warning: Checking this column records conditions that are less severe than errors, but
indicate unexpected conditions. For example, attempting to take a cardholder photo from a
workstation not authorized for badging functions generates a warning diagnostic message.
•
Process1, Process2, Process3: Checking these columns generates diagnostic messages
that record the logic and data as it passes through the system. The least verbose output is
‘Process1,’ the most verbose is ‘Process3.’
•
Performance: Checking this column generates performance statistics, such as memory or
network bandwidth usage.
