1 ric plot to locate specific compounds – INFICON HAPSITE ER Chemical Identification System User Manual
Page 307
9 - 21
IP
N 07
4-
47
1-
P1
B
HAPSITE ER Operating Manual
9.7.1 RIC Plot to Locate Specific Compounds
NOTE: Before running NIST, position the scan cursor over the peak of interest in
the TIC plot.
1
Either from the System Setup View or the Data Review screen, double-click on
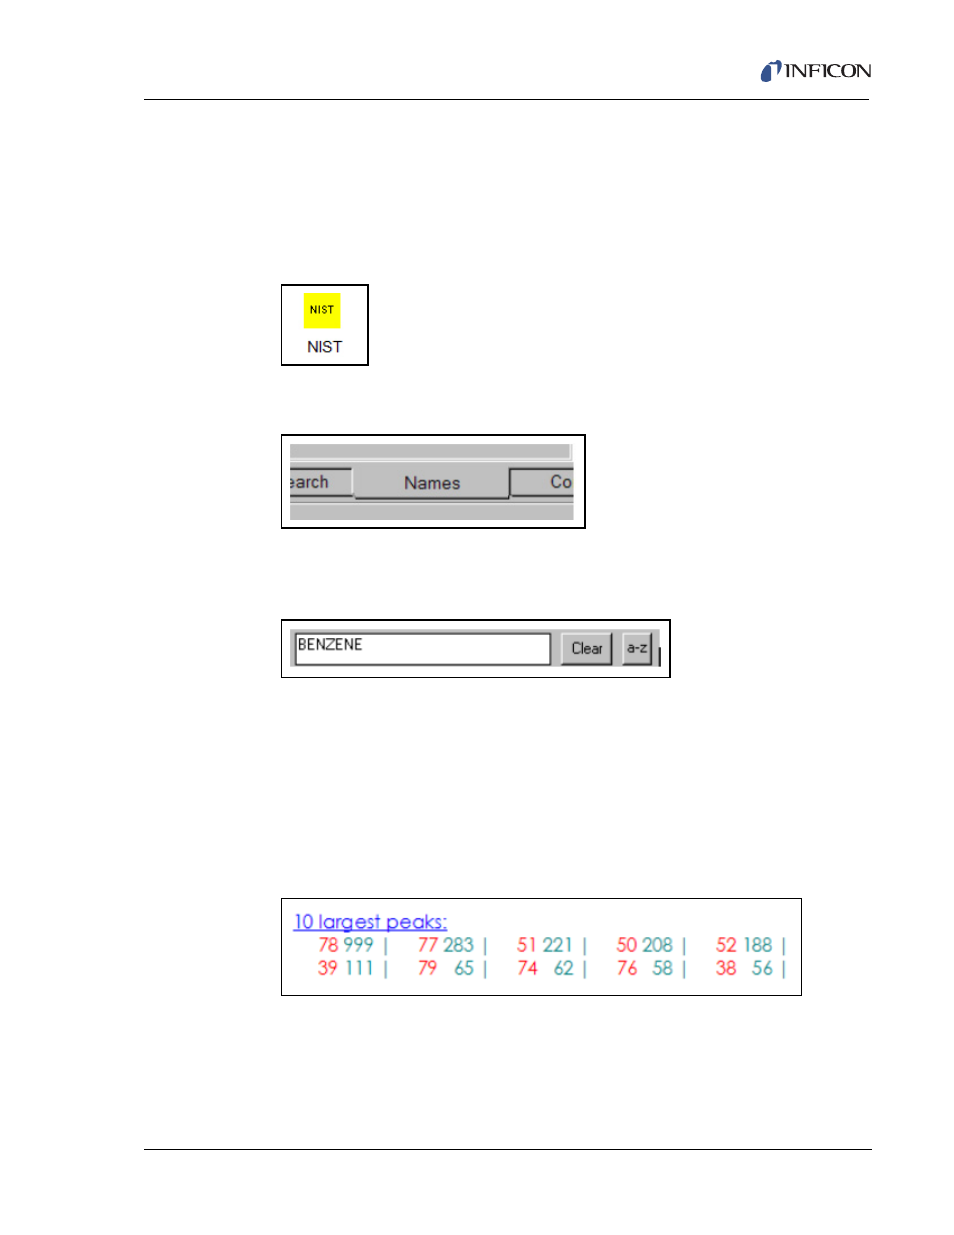
the NIST icon. See
Figure 9-21 NIST Icon
2
Click on the NAMES tab at the bottom of the NIST screen. See
Figure 9-22 NIST Names Tab
3
Enter the name of the compound, to be located, in the box on the top left of the
screen. EXAMPLE: Benzene. See
Figure 9-23 NIST Name Entry
4
The spectrum and information about the compound will appear in the two boxes
to the right of the names column.
5
In the bottom right box, the 10 Largest Peaks will be listed. Make a note of the
three largest mass peaks that are between 45-300 AMU.
NOTE: Peaks are listed in order from the largest to the smallest. EXAMPLE:
Benzene's three largest peaks are masses 78, 77 and 51. See
Figure 9-24 Top 10 Masses
6
Minimize the NIST window and return to the ER IQ Data screen displaying the
TIC chromatogram.
- TGF10 Tracer Gas Filler (36 pages)
- Sensistor ILS500 F Leak Detection Filler (90 pages)
- T-Guard Leak Detection Sensor (85 pages)
- T-Guard Leak Detection Sensor Interface description (40 pages)
- Sensistor ISH2000P Hydrogen Leak Detector, Panel Model (51 pages)
- Sensistor ISH2000 HySpeed Hydrogen Leak Detector (54 pages)
- LDS3000 Modular Leak Detector (52 pages)
- LDS3000 Modular Leak Detector Interface description (56 pages)
- BM1000 Bus module (14 pages)
- I/O1000 I/O module (18 pages)
- CU1000 Control unit (24 pages)
- Helium Leak Detector Modul1000 (130 pages)
- Helium Leak Detector Modul1000 Interface description (40 pages)
- UL5000 Dry Helium Leak Detector (108 pages)
- UL5000 Dry Helium Leak Detector Interface description (14 pages)
- UL1000 Fab Dry Helium Leak Detector (119 pages)
- HLD6000 Refrigerant Leak Detector (76 pages)
- HLD6000 Refrigerant Leak Detector Interface Description (40 pages)
- IO1000 I/O module (18 pages)
- Ecotec E3000 Multigas-Sniffer-Leak Detector (92 pages)
- Ecotec E3000 Multigas-Sniffer-Leak Detector Interface description (36 pages)
- Sensistor XRS9012 Hydrogen Leak Detector User Manual (28 pages)
- Sensistor XRS9012 Hydrogen Leak Detector Maintenance manual (14 pages)
- Extrima Ex-certified Hydrogen Leak Detector (62 pages)
- Sensistor ILS500 Leak Detection System (107 pages)
- Sensistor ISH2000 Hydrogen Leak Detector (108 pages)
- Sensistor ISH2000 Hydrogen Leak Detector (58 pages)
- Sensistor Sentrac Hydrogen Leak Detector (86 pages)
- Protec P3000(XL) Helium Leak Detector (132 pages)
- Pilot Plus Vacuum Gauge (2 pages)
- CO Check Carbon Monoxide Meter (2 pages)
- GAS-Mate Combustible Gas Leak Detector (12 pages)
- Whisper Ultrasonic Leak Detector (8 pages)
- Vortex AC Refrigerant Recovery Machine 115V (20 pages)
- Vortex AC Refrigerant Recovery Machine 230V (16 pages)
- Wey-TEK Refrigerant Charging Scale & Optional Charging Module (2 pages)
- Wey-TEK Refrigerant Charging Scale & Optional Charging Module (44 pages)
- D-TEK CO2 Refrigerant Leak Detector (12 pages)
- TEK-Mate Refrigerant Leak Detector (12 pages)
- Compass Refrigerant Leak Detector (12 pages)
- D-TEK Select Refrigerant Leak Detector (12 pages)
- Explorer Portable Gas Chromatograph (369 pages)
- MicroFID II Portable Flame Ionization Detector (89 pages)
- DataFID Portable Flame Ionization Detector for Landfill Emissions Monitoring (91 pages)
- Hydrostik Hydrogen Fuel Cylinder Installation (7 pages)