2 rmb in the spectrum display window – INFICON HAPSITE ER Chemical Identification System User Manual
Page 295
9 - 9
IP
N 07
4-
47
1-
P1
B
HAPSITE ER Operating Manual
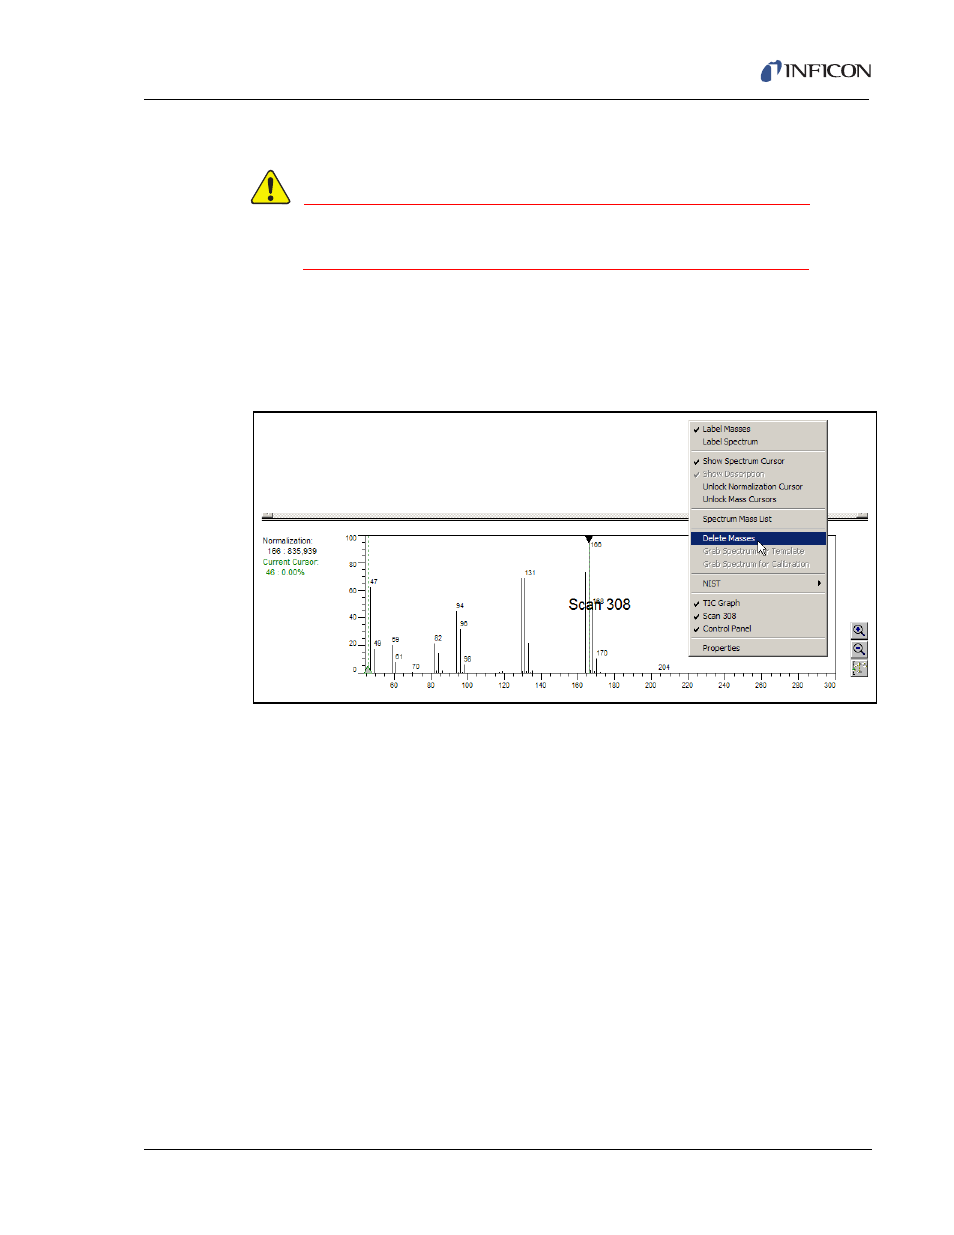
9.4.2 RMB in the Spectrum Display Window
WARNING
Be careful not to subtract data/peaks that may be needed
for proper identification within the chromatogram.
The Spectrum display is shown in the Scan Window. Every time the LMB (Left
Mouse Button) is double-clicked in the TIC window, a spectrum for that scan is
displayed. Clicking the RMB in the Scan/Spectrum window will access the menu
shown in
Figure 9-8
.
Figure 9-8 Spectrum Display Menu
Label Masses . . . . . . . . . . . . . . . . . When checked, it will display the mass
numbers in the Spectrum window.
Label Spectrum. . . . . . . . . . . . . . . . Brings up a text box to allow the analyst to
manually label the Spectrum in the Spectrum
window.
Show Spectrum Cursor . . . . . . . . . Shows the Spectrum Cursor in the Spectrum
window.
Show Description . . . . . . . . . . . . . . Will display the description of the Scan
Cursor location and normalization mass. If
Search the NIST Library is checked, this will
display the NIST match information in the
Spectrum window along with providing
additional description options in the Control
Panel Window.
NOTE: Show description is only active if
Search NIST/User is selected.