4 pakbus graph, Pakbus graph -16 – Campbell Scientific LoggerNet Datalogger Support Software User Manual
Page 206

Section 6. Network Status and Resolving Communication Problems
When you first open Comm Test, the state of the devices is unknown, so the
circles for each device will appear grey. To initiate the test, click on one or
more of the datalogger stations to select them (the circles will appear blue), and
press the Test button. The LoggerNet server will attempt to contact the
selected device(s) and perform a simple clock check. While a test is in
progress, the circle for a device will appear yellow. Once the test is performed,
the resulting circle will be green (clock check successful) or red (clock check
failed).
Press Reset Test to clear the test results before running the test again.
By default, the Communication Test window shows all devices in the network.
You can display on the stations by selecting the Show Stations Only check box.
6.4 PakBus Graph
PakBus Graph is a utility that graphically depicts the connections in a
LoggerNet PakBus datalogger network. It provides a look at LoggerNet’s
PakBus routing table. In addition, the utility can be used to change the settings
of a PakBus device.
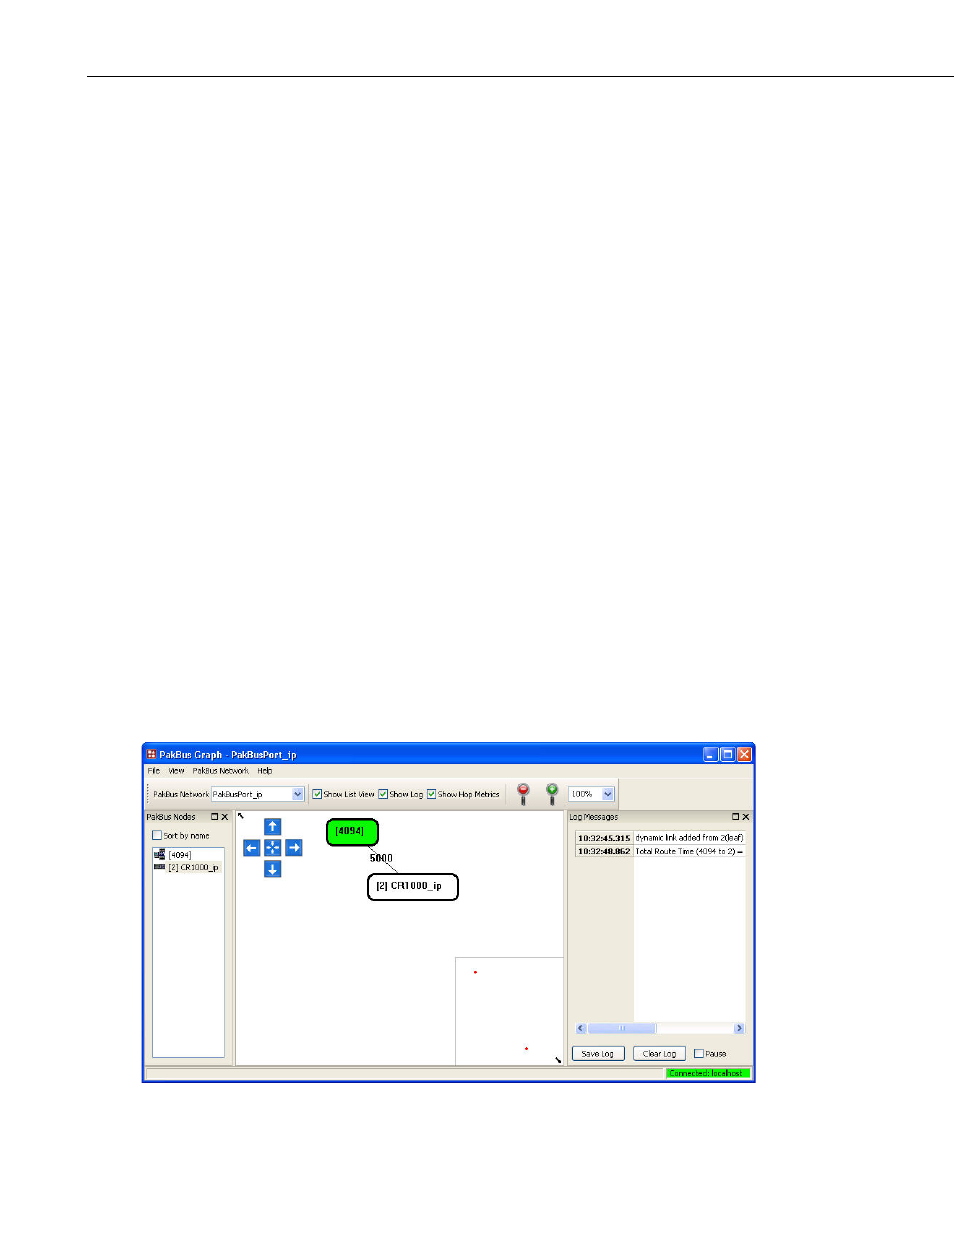
The window for PakBus graph is divided into three sections: the list of PakBus
devices, a graphical depiction of the PakBus network, and the log messages for
PakBus communication. The list of devices and the log can be toggled off by
clearing the Show List View and Show Log options, respectively.
Software servers are identified in PakBus Graph by the color green. Other
devices remain colorless unless they have been selected with the mouse cursor.
When selected, they are colored cyan.
The default PakBus address for LoggerNet is 4094. Other PakBus devices will
be shown by name and address, if known.
PakBus Graph can be opened from the LoggerNet Toolbar’s Tools category.
6-16
