Monitoring sequential function charts, Monitoring ladder diagrams, Figure 15.3—active step in an sfc – Watlow LogicPro User Manual
Page 255
LogicPro User’s Guide
Chapter 15: Downloading & Monitoring
Doc.# 28002-00 Rev 3.00
Watlow Anafaze
239
NOTE!
Having too many monitoring windows open at the
same time can cause performance degradation. If
this happens, close some of the monitoring win-
dows or turn Monitoring Off for some of these
windows.
Monitoring Sequential Function Charts
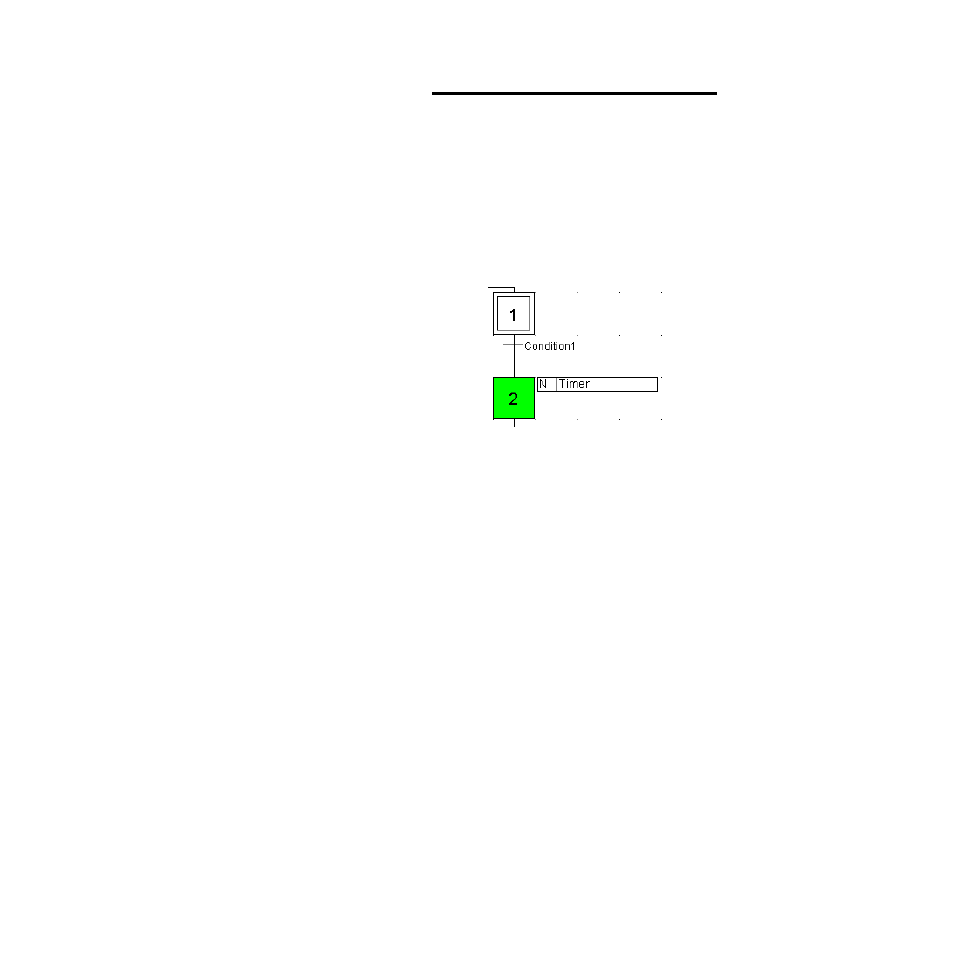
LogicPro identifies the active step in the running SFC by
highlighting it in green, see Figure 15.3.
Figure 15.3 Active Step in an SFC
You can also monitor individual actions in Sequential
Function Chart programs.
To open a monitoring window for an action:
1.
Select the
View
menu.
2.
Click on the action in the program.
3.
Select
Monitor On/Off
– or –
Click on the
[Monitor On/Off]
tool to toggle Monitor-
ing on or off in each window.
4.
When you are finished monitoring the SFC, select
Win-
dows
then
Close All
to close the monitoring windows.
Monitoring Ladder Diagrams
In a Ladder Diagram, LogicPro indicates the state of a
variable associated with an element by coloring it bright green
when it is equal to one. This is true for all contacts and coils
except the normally closed contact which is bright green when
the variable associated with it is equal to zero. See Figure 15.4
on page 240.