Planning tool, General, Sky plot – Ag Leader GeoSteer Operation Manual User Manual
Page 135
Planning
Tool
Operator’s
Manual
121
Planning Tool
The Planning Tool screen provides information about the predicted quality of the GPS and expected GPS availability. It
enables user to make decisions about farming applications based on GPS availability. The following Planning Tool options are
available:
• General – This provides the location of the vehicle.
• Sky Plot – This provides a graphical representation of the location of the GPS satellites in the sky.
• Forecast – This provides an estimate of how many satellites will be available over time and what the predicted accuracy of
those satellites will be.
General
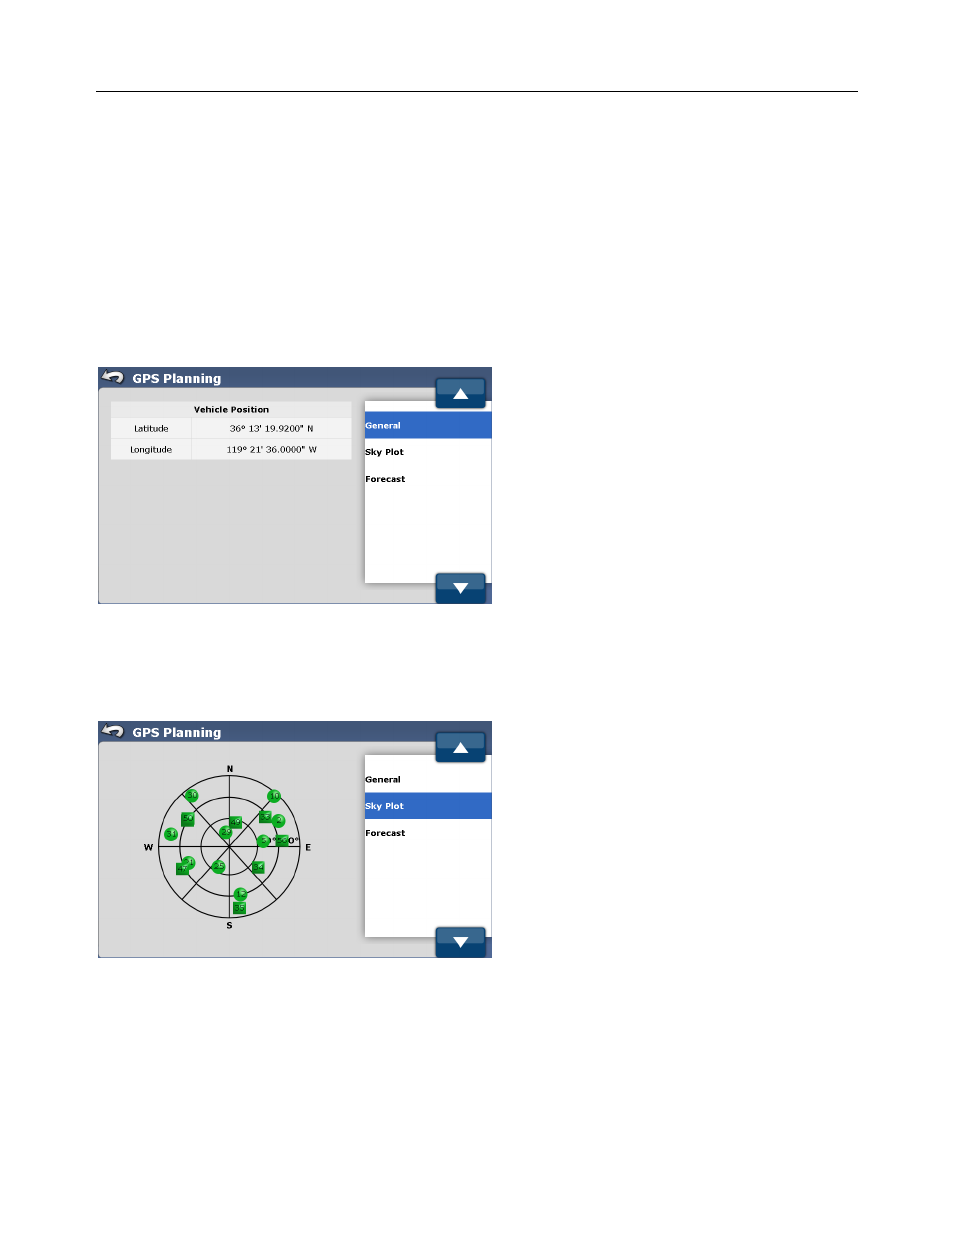
Figure 4-45 GPS Planning General
The General screen shows the current vehicle position in latitude and longitude
Sky Plot
Figure 4-46 GPS Sky Plot
The Sky Plot screen shows the Satellites being tracked and their positions. The satellites that are closer to the outer circle are
closer to the horizon and will typically have more errors due to the longer distance the signal has to travel and atmospheric
disturbances. The second ring from the outside represents 30 degrees above the horizon. The third ring from the outside
represents 60 degrees above the horizon. The center of the circle represents 90 degrees above the horizon or directly overhead.
North is to the top of the circle. The rest of the directions correspond to the normal directions in a map. By looking at this
figure, all the GPS and GLONASS satellites can be located in the sky. This graph can help tell if the satellites have a poor
geometry for providing position fixes.