Audiobus measure/graph setup detail, Serial data debug solutions 96 – Teledyne LeCroy Serial Data Debug Solutions User Manual
Page 96
Serial Data Debug Solutions
96
919586 RevA
Note: For Rising or Falling Edge Types, a Data Value display field is shown and is converted based on
your last Setup Format selection made for a Data Type (steps 3 and 5, previous).
The Rising edge type triggers when audio values cross above the Threshold level specified. Falling
triggers when the values cross below the Threshold level specified.
6.
D
ATA
P
ATTERN
S
ETUP
-
O
NLY
A
VAILABLE FOR
D
ATA
T
YPE
S
ETUP
Note: This setup sections only appears when the Data type is chosen from the Type (step 3, previous).
Data Condition - Select from Equal, Not Equal, Less than, Less than or Equal to, Greather than, Greater
than or Equal to, In Range, or Out Range conditions available. The default setting is Equal.
Data Value - Use this field's keypad to specify an exact amount.
Data Value To - Use this field's keypad to specify an exact amount.
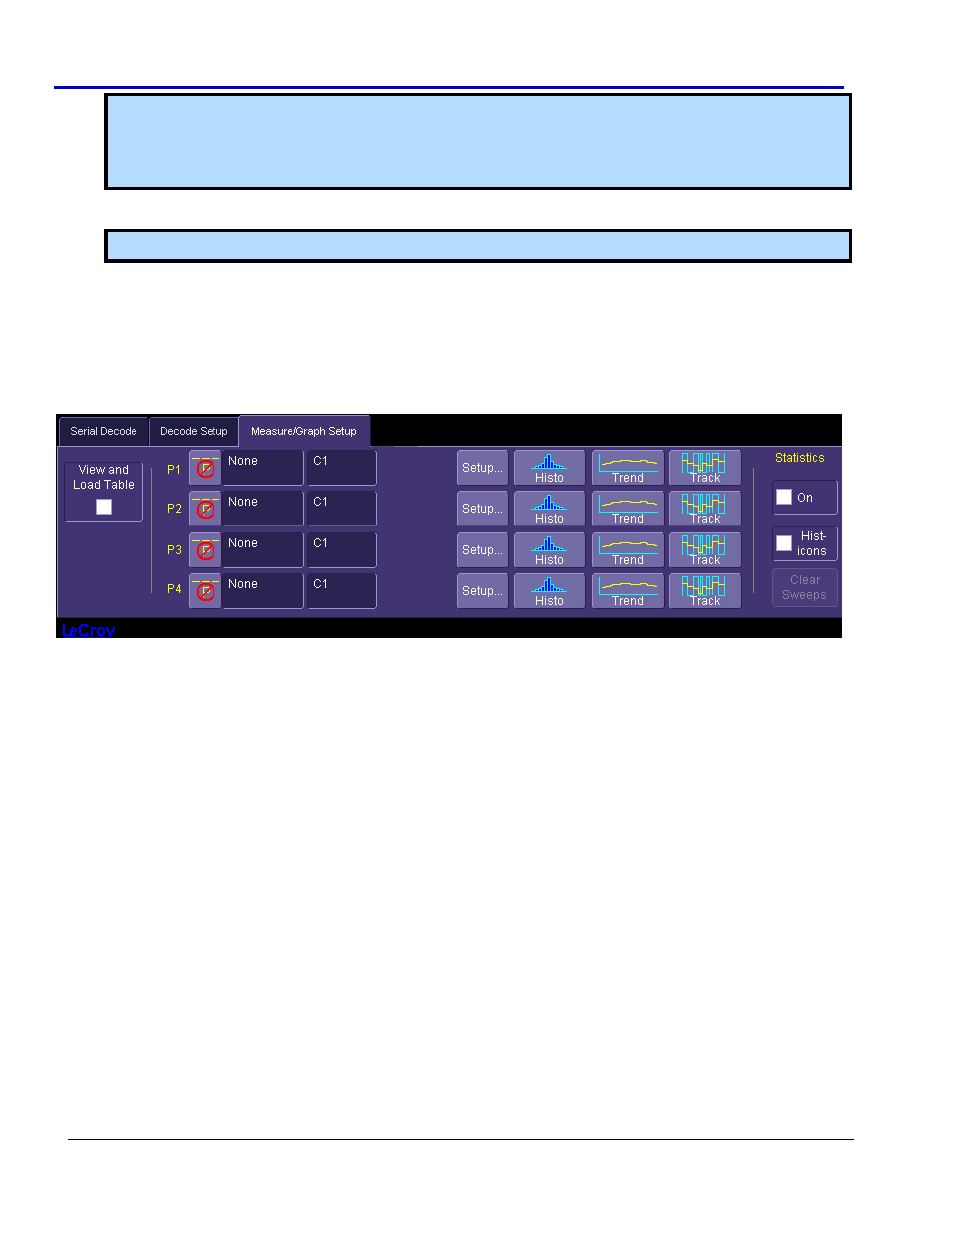
AudioBus Measure/Graph Setup Detail
The following topics explain selections on the AudioBus Measure/Graph Setup... dialog.
Controls on this dialog are described as follows:
1. View and Load Table - Use this checkbox to add or remove settings to your waveform on the signal
display grid and show data under the grid in tabular format.
2. P1 - P4 - Each of the four Decoders can be assigned a Measurement Parameter value. Click the button or
field to choose from the Select Measurement pop-up.
3. There's also a corresponding field where you can specify the Source.
4. Setup Button - Click the Setup... button. The corresponding Decode and the Measurement Parameter
dialog is shown where you can make additional settings. There are additional dialogs on the right where
even more Decode settings can be made.
5. Histo, Trend, and Track Buttons - Each Decode also has a Histo, Trend, and Track button. Click the desired
button and choose which Math trace in which you want to display results.
6. Statistics - Use the On and Histicons checkboxes to display data on the signal display grid. Use the Clear
Sweeps button (when enabled) to clear the data from multiple acquisitions.