Operator's manual – Teledyne LeCroy Serial Data Debug Solutions User Manual
Page 19
Operator's Manual
919586 RevA
19
P
ROTOCOL
R
ESULTS
T
ABLE
The protocol results table provides a quick and easy way to understand all of your protocol data as decoded by
the oscilloscope, even when messages are too compact to allow annotation on the display. In addition, the table
provides a quick and easy method to view decode results and quickly zoom to a specific message. Since the table
uses the decoded data (extracted as previously described) as its source, the View Table button (from the user
interfaces) is always checked and the table is shown by default as signals are decoded.
Note: All protocols with Decode (D) capability have a corresponding decode result table. Selecting a row on
the table creates a zoom of the specific row/message, regardless of protocol. Refer to Using The D Supported
Protocol Toolsets (on page 14) for more information about the View Table button and other information
about the protocol results table.
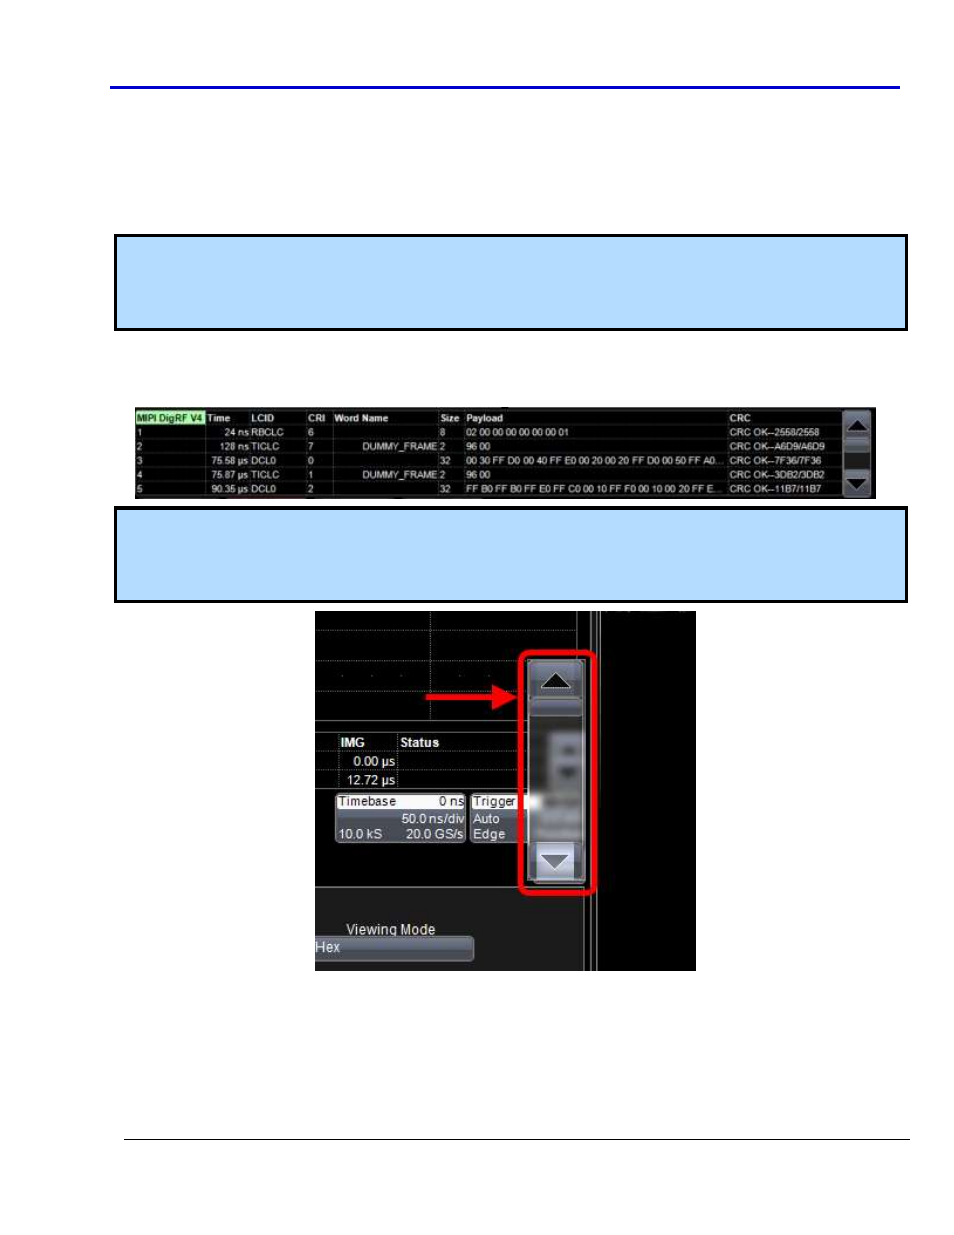
When displayed, the protocol results table appears under the waveform grid. The following protocol results
table is showing DigRF V4 data (each protocol's table looks different) and provides an example of what the table
looks like:
Note: If a value of only 1 - 4 rows is provided, oscilloscope models provide different solutions. Some replace
the vertical scroll bar to the right of the table with a pop-up scroll for more convenient use. Others turn the
vertical scroll bar yellow, indicating that the Adjust knob on the oscilloscope front panel can be used to
navigate table rows.
The first column heading (top left most cell of the table) bears the name of the corresponding protocol and the
cell's fill color matches the protocol color used on the grid display.