Operator's manual – Teledyne LeCroy Serial Data Debug Solutions User Manual
Page 25
Operator's Manual
919586 RevA
25
P
X
D
IALOG
Source
Select the source for you parameter measurement. The source for a measurement made on a decoded
waveform should be the DecodeX applied to the channel and not the Cx channel itself.
Measure
Click in this field to select the desired measurement from the pop-up.
Protocol measurements (where applicable) can also be selected as the source for histogram, trend, or track
functions.
Actions for Px
Histo - The Histogram displays a statistical distribution of a measurement parameter. Histogram is helpful
to understand the modality of a measurement parameter, and to debug the root cause of excessive
variation.
Note: After touching Histo, Trend, or Track buttons, a Math selection pop-up is shown to select which
Math trace in which you want the results to be placed.
Trend - The Trend statistical tool visualizes the evolution of a timing parameter over time in the form of a
line graph. The graph’s vertical axis is the value of the parameter; its horizontal axis is the order in which
values were acquired. Trend is typically used for a multi-shot acquisition. Trend is analogous to a chart
recorder.
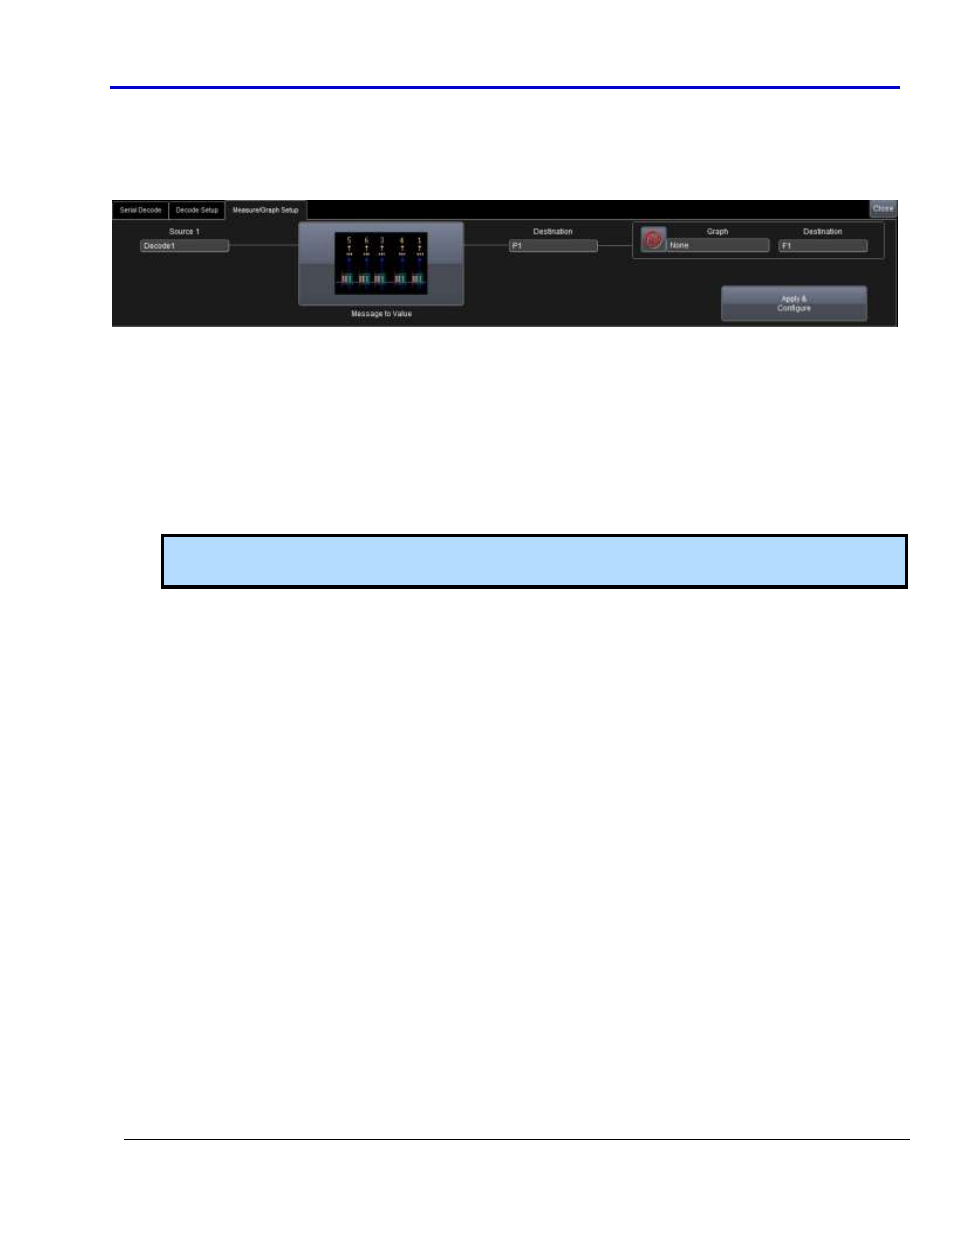
Track - The Track displays a time-correlated accumulation of values for a single acquisition. Track can be
used to plot the digital-to-analog converted (DAC) values of serial data (using the Message to Value
parameter) and compare them to a corresponding analog signal, or observe changes in timing. Track is
typically used for a single-shot acquisition. A long acquisition with many parameter measurements
analyzed with Track could provide information about the modulation of the parameter.
Now, on the main Measure dialog, additional settings can be made as follows:
M
EASURE
D
IALOG
Statistics
Mark the On checkbox to add the statistics of your data to the lower grid display area (same area as displayed
data for the View and Load Table checkbox).