ZyXEL Communications 200 Series User Manual
Page 728
Chapter 46 Reports
ZyWALL USG 100/200 Series User’s Guide
728
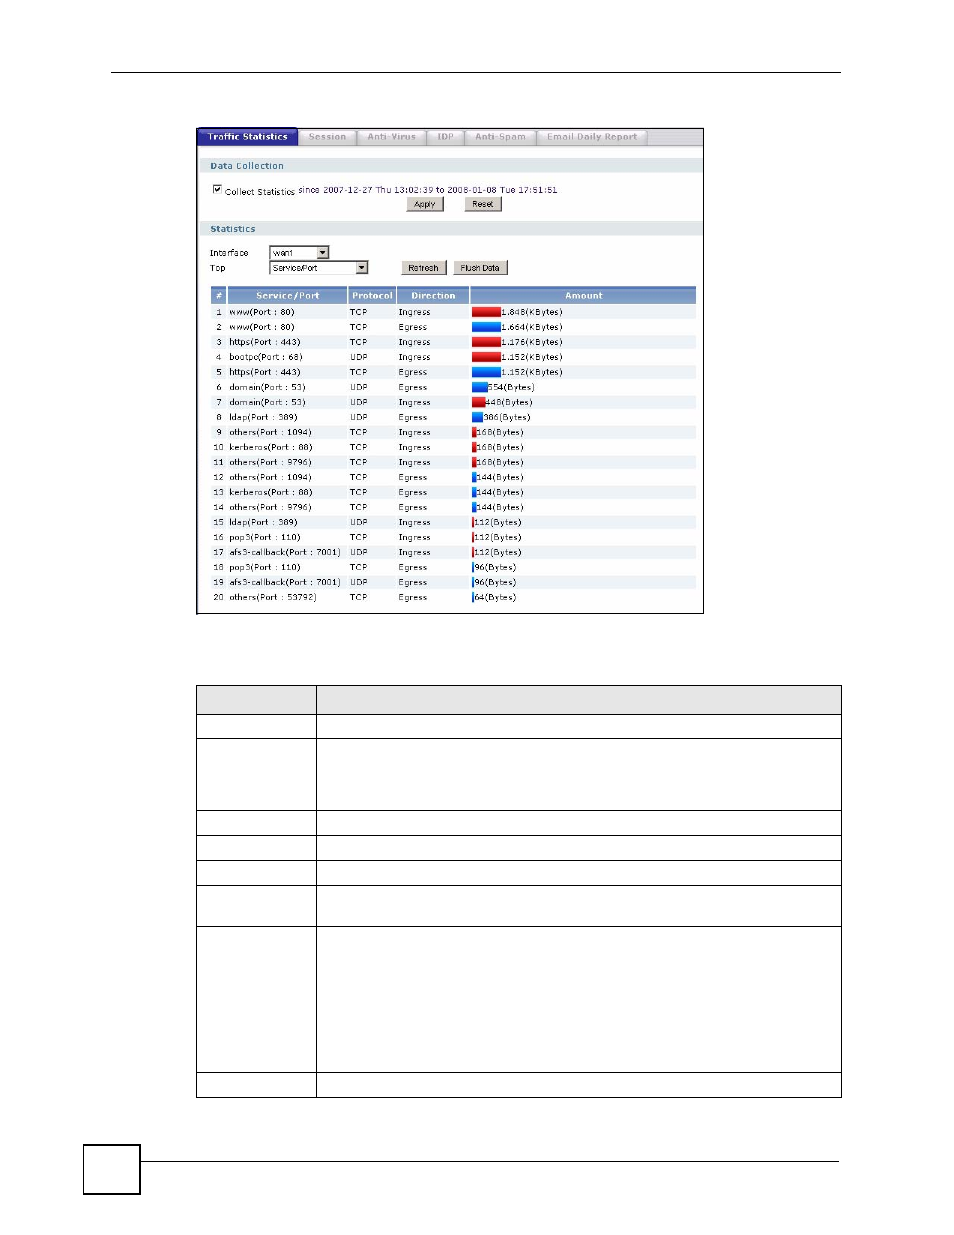
Figure 543 Maintenance > Report > Traffic Statistics
There is a limit on the number of records shown in the report. Please see
for more information. The following table describes the labels in this screen.
Table 258 Maintenance > Report > Traffic Statistics
LABEL
DESCRIPTION
Data Collection
Collect Statistics
Select this to have the ZyWALL collect data for the report. If the ZyWALL has
already been collecting data, the collection period displays to the right. The
progress is not tracked here real-time, but you can click the Refresh button to
update it.
Apply
Click Apply to save your changes back to the ZyWALL.
Reset
Click Reset to begin configuring this screen afresh.
Statistics
Interface
Select the interface from which to collect information. You can collect information
from Ethernet, VLAN, bridge, PPPoE/PPTP, and auxiliary interfaces.
Traffic Type
Select the type of report to display. Choices are:
Host IP Address/User - displays the IP addresses or users with the most traffic
and how much traffic has been sent to and from each one.
Service/Port - displays the most-used protocols or service ports and the amount of
traffic for each one.
Web Site Hits - displays the most-visited Web sites and how many times each one
has been visited.
Each type of report has different information in the report (below).
Refresh
Click this button to update the report display.