Memory usage, Dynamic memory equalizer, Memory management information – H3C Technologies H3C Intelligent Management Center User Manual
Page 666
652
{
Trend graph—View the changes of the logical processor usage ratio for the Hyper-V server in a
line chart. Point to a spot on the curve to view the logical processor usage ratio at the specific
time point. Authorized users can view the changes of the logical processor usage ratio over a
specific time period by clicking the Last 1 Hour icon
, Last 6 Hours icon
, Today icon
,
Yesterday icon
, This Week icon
, This Month icon
, and This Year icon
. The
default time period is last 1 hour.
•
Total Usage—Total usage of logical processors in the last APM polling period.
•
Guest Code—Percentage of the logical processors that process Guest Code in the last APM polling
period.
•
Management System—Percentage of the logical processors occupied by the Hyper-V system in the
last APM polling period.
•
Free—Percentage of the unused logical processors in the last APM polling period.
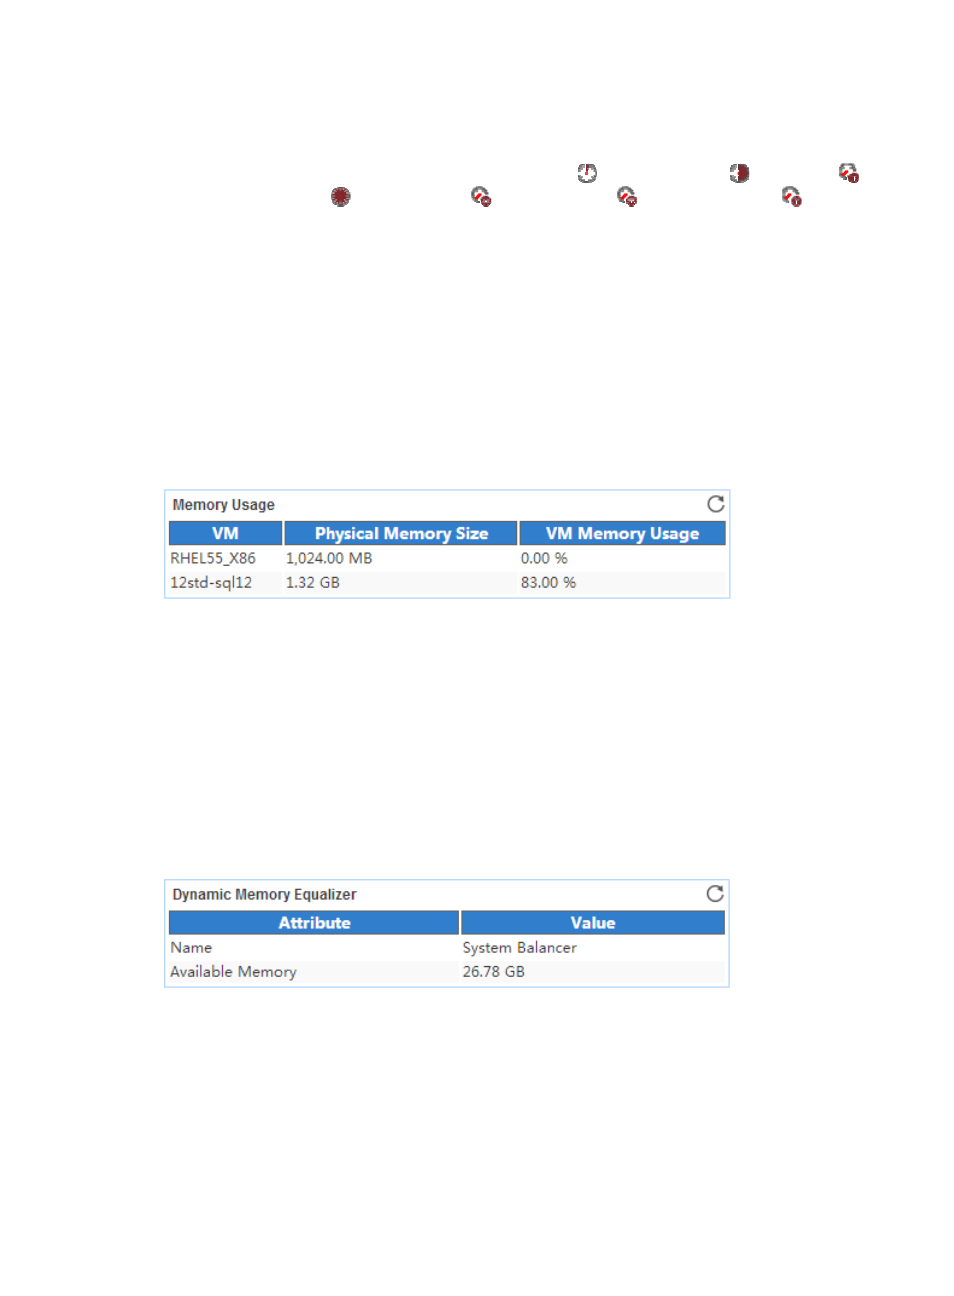
Memory Usage
The Memory Usage area layout is shown in
.
Figure 560 Memory Usage area layout
Memory Usage area fields:
•
VM—Name of the VM running on the Hyper-V server.
•
Physical Memory Usage—Physical memory size assigned to the VM.
•
Current Pressure—VM memory usage in the last APM polling period. It is calculated by using the
following formula: Current pressure = Memory size used by the VM/Memory size assigned to the
VM x 100%.
Dynamic Memory Equalizer
The Dynamic Memory Equalizer area layout is shown in
Figure 561 Dynamic Memory Equalizer area layout
Dynamic Memory Equalizer area fields:
•
Name—Name of the dynamic memory equalizer.
•
Available Memory—Available memory size of the dynamic memory equalizer in the last APM
polling period.
Memory Management Information
The Memory Management Information area layout is shown in