Session information, Process – H3C Technologies H3C Intelligent Management Center User Manual
Page 150
136
•
Input Error Packet Rate—Number of lost inbound error packets per second on a network interface
card in the last APM polling period.
•
Output Error Packet Rate—Number of lost outbound error packets per second on a network
interface card in the last APM polling period.
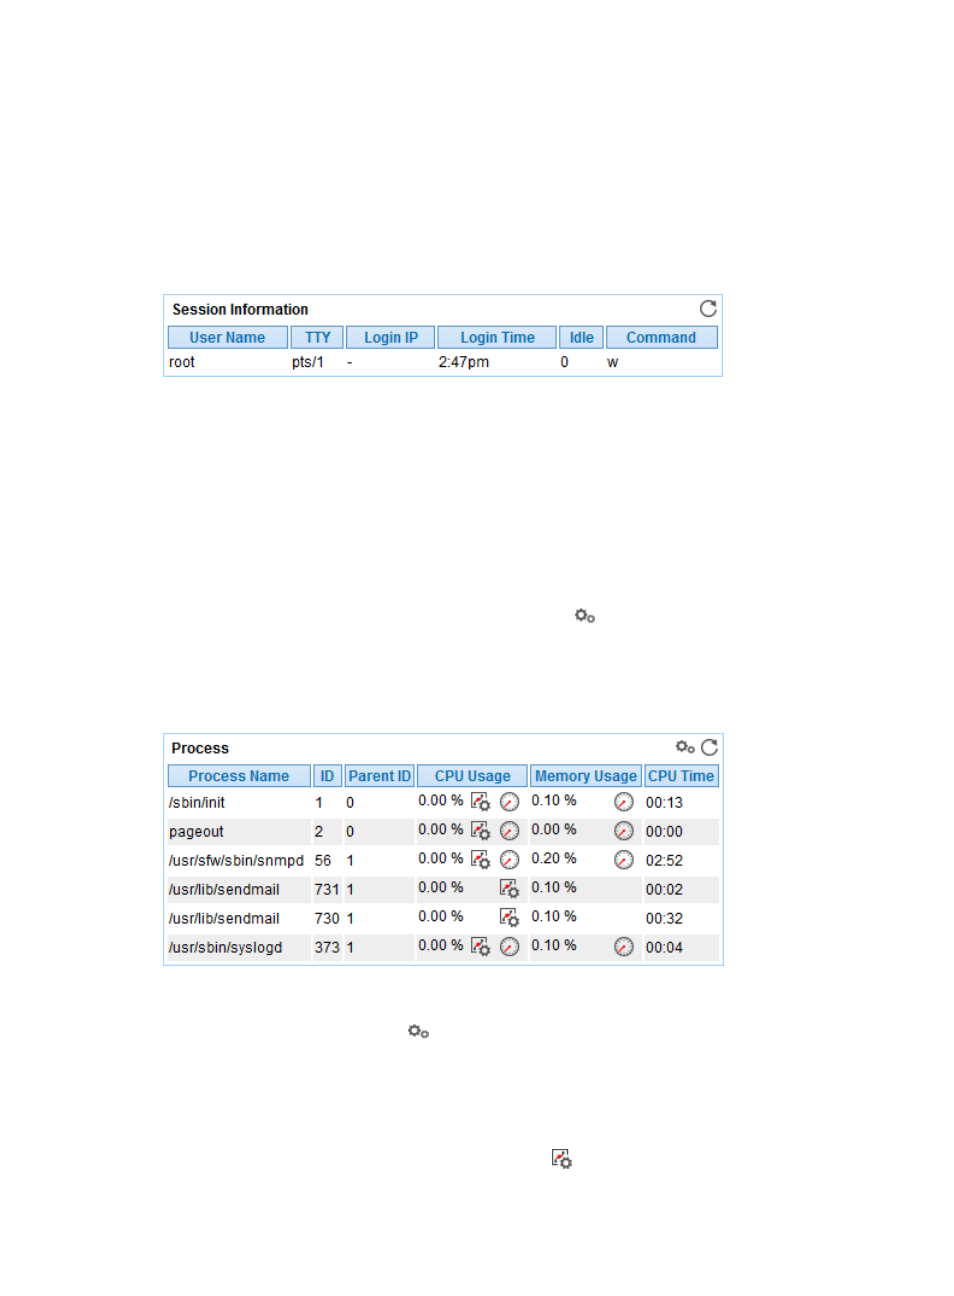
Session Information
The Session Information area displays Solaris session login information.
Figure 85 Session Information area layout
Session Information area fields:
•
User Name—User logging in to Solaris in the most recent polling interval.
•
TTY—TTY used by the user.
•
Login Time—Time when the user logs in to Solaris.
•
Idle—Idle time after the user logs in to Solaris.
•
Command—Most recently executed command after the user logs in to Solaris.
Process
To monitor processes on Solaris, click the Configuration icon
to select the processes to be monitored.
APM collects the index data for the monitored processes during the next host polling, which includes the
CPU usage ratio and memory usage ratio. The monitored processes and the corresponding index data
are displayed in the Process area, as shown in
.
Figure 86 Process area layout
Process area fields:
•
Config—Click the Config icon
to select the processes to be monitored in the monitor list
window.
•
Process Name—Name of the monitored process. APM can respectively collect index data for the
processes that have the same name, but different in Process Identifier (PID).
•
CPU Usage—CPU usage ratio of the monitored process in the last APM polling period.
{
Set Threshold—Click the Threshold setting icon
to set alarm thresholds of the CPU usage
ratio for the monitored process. The data is highlighted in orange when the CPU usage ratio