Performance, Copy statistics – H3C Technologies H3C Intelligent Management Center User Manual
Page 491
477
yesterday, this week, this month, and this year by clicking the corresponding icons on the upper
right of the graph.
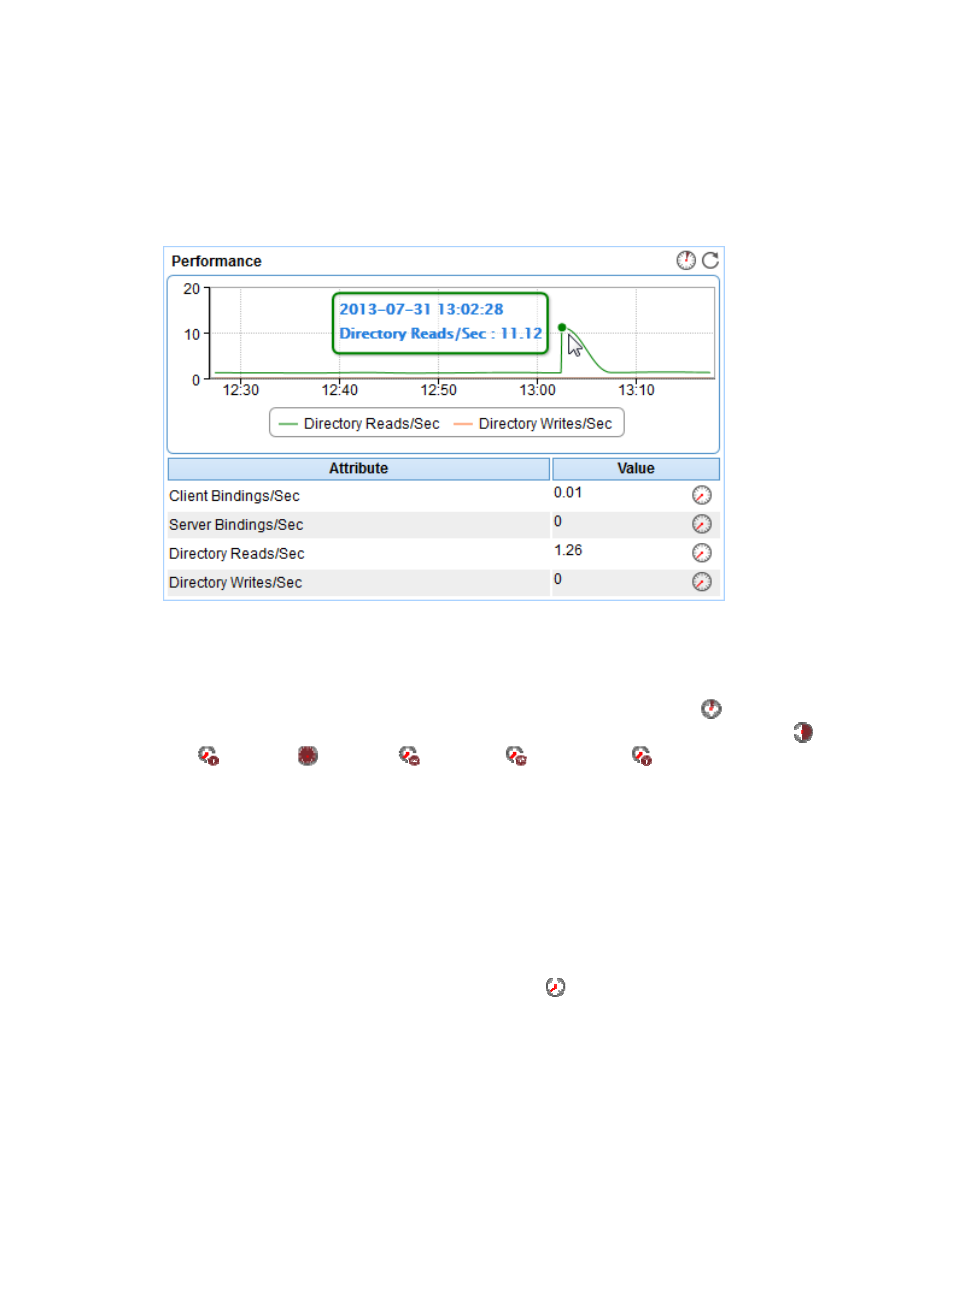
Performance
The Performance area layout is shown in
Figure 397 Performance area layout
Performance area fields:
•
Performance trend graph—Shows changes of directory reads/writes per second over the last 1
hour in a line chart. Point to a spot on the curve to view the directory reads/writes per second at the
specific time point. To change the report period, click the Last 1 Hour icon
on the upper right of
the graph, and then select an icon from the list. Available options include Last 6 Hours
, Today
, Yesterday
, This Week
, This Month
, and This Year
.
•
Attribute/Value—Monitor index name and data.
{
Client Bindings/Sec—Number of DC-to-client bindings per second in the last APM polling
period.
{
Server Bindings/Sec—Number of DC-to-DC bindings per second in the last APM polling
period.
{
Directory Reads/Sec—Number of reads from directory per second in the last APM polling
period.
{
Directory Writes/Sec—Number of writes to directory per second in the last APM polling period.
{
History Record—Click the History Record icon
to view the history graph of the AD
performance index data trend. Point to a spot on the curve to view the AD performance index
data at the specific time point. Authorized users can view the AD performance index data over
the last 1 hour, last 6 hours, today, yesterday, this week, this month, and this year by clicking the
corresponding icons on the upper right of the graph.
Copy Statistics
The Copy Statistics area layout is shown in
.