Customizing the application monitor list – H3C Technologies H3C Intelligent Management Center User Manual
Page 43
29
{
In Traffic (H)—Traffic received by the application in the last hour. This field does not appear by
default.
{
Out Traffic (H)—Traffic sent by the application in the last hour. This field does not appear by
default.
{
Traffic (D)—Total traffic received and sent by the application today. This field does not appear
by default.
{
In Traffic (D)—Traffic received by the application today. This field does not appear by default.
{
Out Traffic (D)—Traffic sent by the application today. This field does not appear by default.
{
Description—Description about the application monitor.
{
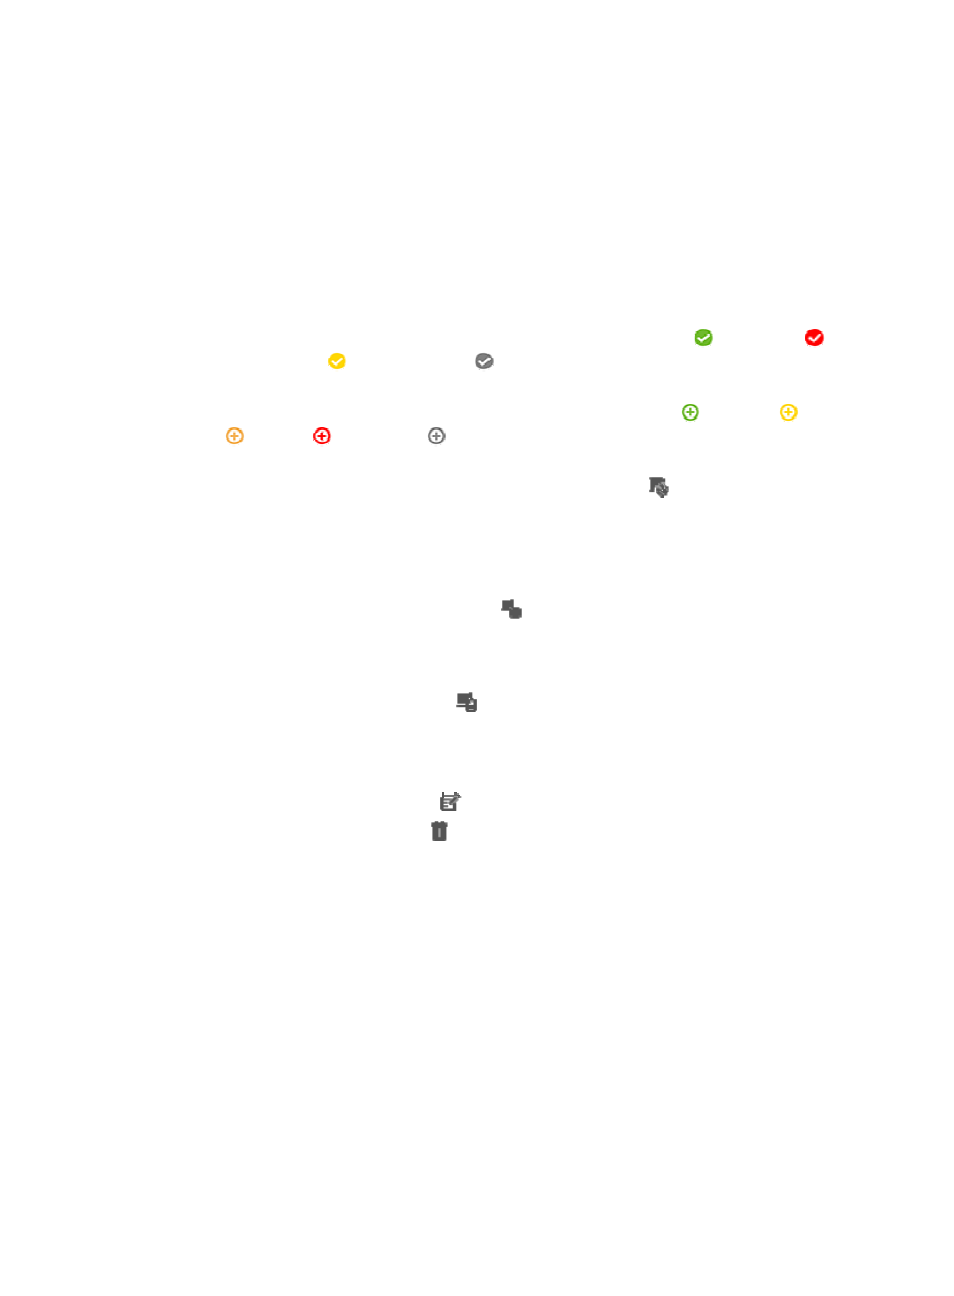
Availability—Availability of the application. The availability can be
(Available),
(Unavailable),
(Inaccessible), or
(Unmanaged). Point to the icon to view the application
availability represented by different colors for the last hour.
{
Health—Health status of the application. The health status can be
(Healthy),
(Minor),
(Major),
(Critical), or
(Unknown). Point to the icon to view the application health
status represented by different colors in the last hour.
{
Dependency Topology—Click the Dependency Topology icon
to view dependencies
between the application and other applications in a topology view. This field does not appear
by default. For more information about the dependency topology, see "
{
Status—Management status of the application, which can be Managed or Unmanaged.
{
Association—Click the Association icon
to view applications associated with the
application monitor. This field appears only when the application is a Windows operating
system that is monitored through WMI. For more information, see "
."
{
Analyze—Click the Analyze icon
to view the causes for the unhealthy status of an
application. For more information about root cause analysis, see "
{
Contact—Contact information of the application administrator. This field does not appear by
default.
{
Modify—Click the Modify icon
to modify the parameters of the application monitor.
{
Delete—Click the Delete icon
to delete the application monitor.
3.
Click Refresh to update the content of the application monitor view list.
Customizing the application monitor list
1.
Click the Resource tab.
2.
Select Application Manager > Application Monitor from the navigation tree.
The application monitor list page displays all application monitors.
3.
Click Custom Page.
The Custom Column page appears.
Customizable columns include:
{
Name (Default)
{
Type of application (Default)
{
Host