Process – H3C Technologies H3C Intelligent Management Center User Manual
Page 202
188
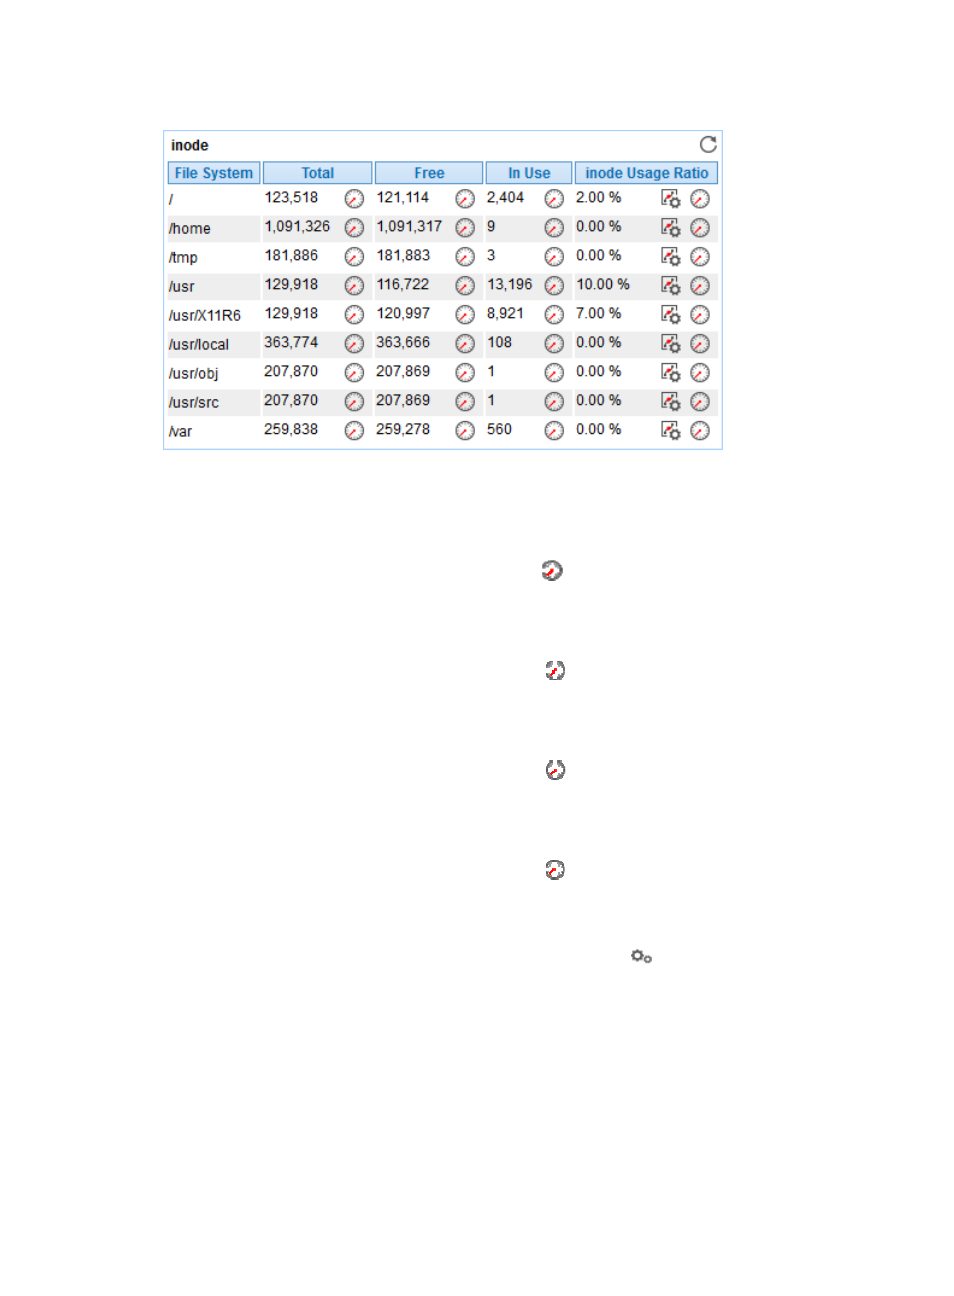
Figure 138 inode area layout
inode area fields:
•
File System—File system on the OpenBSD server.
•
Total—Total number of available inodes in the file system in the most recent polling interval.
{
History Record—Click the History Record icon
to view the change trend of the total number
of inodes in the file system in last 1 hour, last 6 hours, today, yesterday, this week, this month,
or this year.
•
Free—Number of inodes that are not used in the file system in the most recent polling interval.
{
History Record—Click the History Record icon
to view the change trend of the number of
idle inodes in the file system in last 1 hour, last 6 hours, today, yesterday, this week, this month,
or this year.
•
In Use—Number of inodes that have been used in the file system in the most recent polling interval.
{
History Record—Click the History Record icon
to view the change trend of the number of
used inodes in the file system in last 1 hour, last 6 hours, today, yesterday, this week, this month,
or this year.
•
inode Usage Ratio—Usage of inodes in the file system in the most recent polling interval.
{
History Record—Click the History Record icon
to view the change trend of inode usage in
the file system in last 1 hour, last 6 hours, today, yesterday, this week, this month, or this year.
Process
To monitor a process on OpenBSD, click the Configuration icon
to select the processes to be
monitored. APM collects the index data for the monitored processes during the next host polling, which
includes the CPU usage ratio and memory usage ratio. The monitored processes and the corresponding
monitored index data are displayed in the Process area, as shown in