Office search collector – H3C Technologies H3C Intelligent Management Center User Manual
Page 580
566
{
Reports Requested/Sec—Average number of report requests received per second by Excel
calculation services.
{
Active Sessions—Total number of active sessions in Excel calculation services.
{
History Record—Click the History Record icon
to view the history trend graph of the
corresponding index. Point to a spot on the curve to view the monitor data at the specific time
point. Authorized users can view statistics over the last 1 hour, last 6 hours, today, yesterday, this
week, this month, and this year by clicking the corresponding icons on the upper right of the
graph.
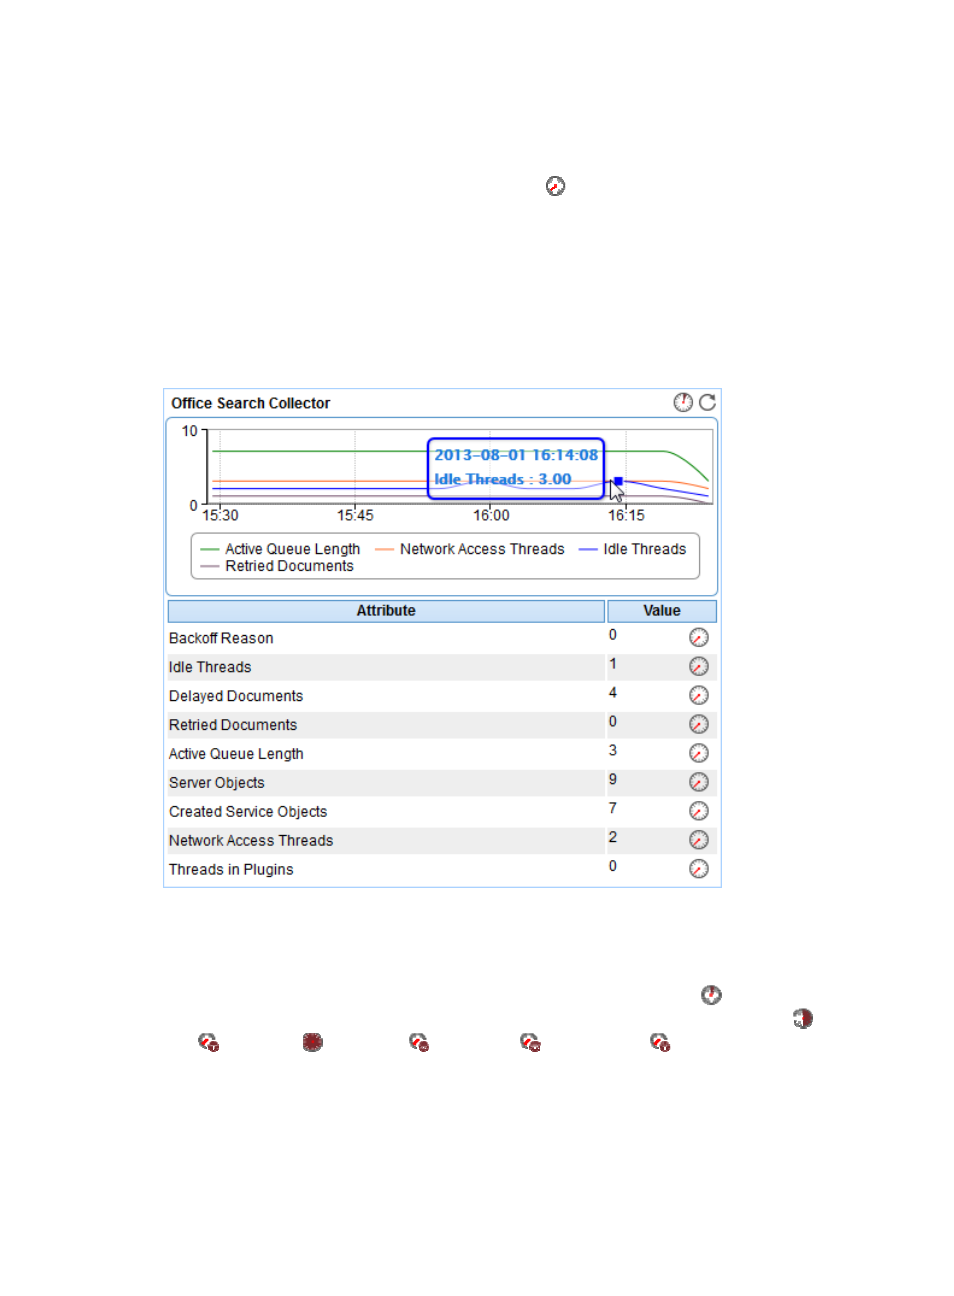
Office Search Collector
The Office Search Collector area layout is shown in
Figure 469 Office Search Collector area layout
Office Search Collector area fields:
•
Office Search Collector trend graph—Shows changes of the Office search collector related index
data over the last 1 hour in a line chart. Point to a spot on the curve to view the monitor data at the
specific time point. To change the report period, click the Last 1 Hour icon
on the upper right of
the graph, and then select an icon from the list. Available options include Last 6 Hours
, Today
, Yesterday
, This Week
, This Month
, and This Year
. Click the legend names to
display or hide the corresponding monitor indexes in the graph.
•
Attribute/Value—Monitor index name and data that was obtained when APM last polled Office
SharePoint 2007.
{
Backoff Reason—Reason that causes the Office search collector to enter backoff state. A value
of 0 indicates the Office search collector is operating correctly. Other different values indicate
different reasons.