Search details – H3C Technologies H3C Intelligent Management Center User Manual
Page 500
486
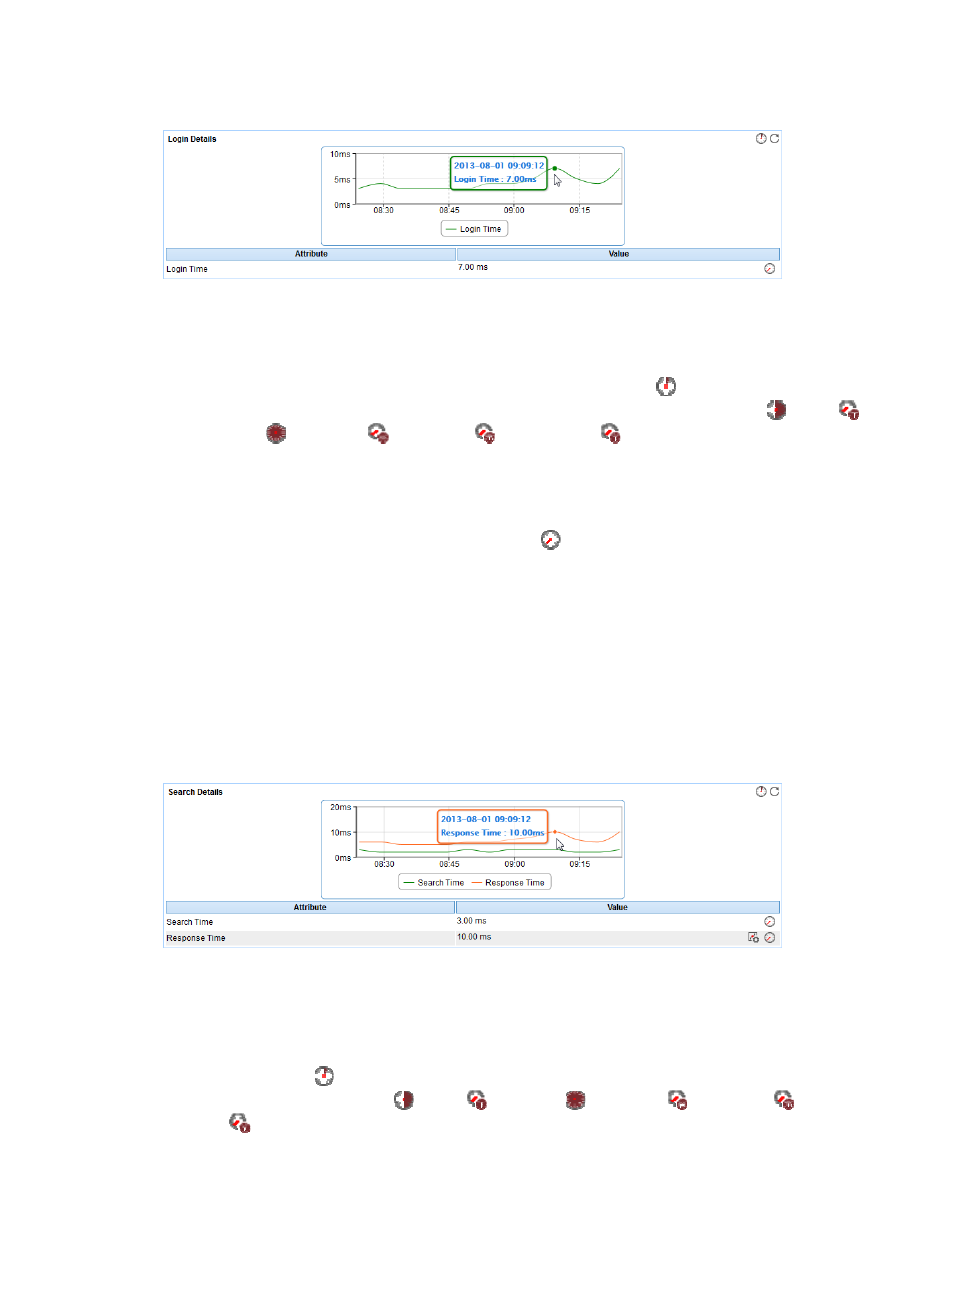
Figure 404 Login Details area layout
Login Details area fields:
•
Login time trend graph—Shows changes of the login time of the LDAP service over the last 1 hour
in a line chart. Point to a spot on the curve to view the login time of the LDAP service at the specific
time point. To change the report period, click the Last 1 Hour icon
on the upper right of the
graph, and then select an icon from the list. Available options include Last 6 Hours
, Today
,
Yesterday
, This Week
, This Month
, and This Year
.
•
Attribute/Value—Monitor index name and data.
{
Login Time—Time taken for APM to pass the LDAP authentication by using the LDAP username
and password in the last APM polling period.
{
History Record—Click the History Record icon
to view the history graph of the LDAP service
login time. Point to a spot on the curve to view the LDAP service login time at the specific time
point. Authorized users can view the LDAP service login time over the last 1 hour, last 6 hours,
today, yesterday, this week, this month, and this year by clicking the corresponding icons on the
upper right of the graph.
Search Details
After passing the LDAP authentication, APM queries all entries of the search base according to the
Search Base and Query Filter configured in the LDAP service application monitor. The Search Details
area layout is shown in
Figure 405 Search Details area layout
Search Details area fields:
•
Search details trend graph—Shows changes of the search time and response time of the LDAP
service over the last 1 hour in a line chart. Point to a spot on the curve to view the search time and
response time of the LDAP service at the specific time point. To change the report period, click the
Last 1 Hour icon
on the upper right of the graph, and then select an icon from the list. Available
options include Last 6 Hours
, Today
, Yesterday
, This Week
, This Month
, and This
Year
.
•
Attribute/Value—Monitor index name and data.