Application traffic, Jvm details – H3C Technologies H3C Intelligent Management Center User Manual
Page 363
349
•
Memory usage trend graph—Shows the memory usage trend of the OPMN over the selected time
period in a line graph. Point to a spot in the curve to view the memory usage data at the specific
time point. By default, the graph shows the last 1 hour data. To change the report period, click the
Last 1 Hour icon
on the upper right of the graph, and then select an icon from the list. Available
options include Last 6 Hours
, Today
, Yesterday
, This Week
, This Month
, and This
Year
.
•
Attribute/Value—Monitor index name and data.
{
Memory Used Percent—Percentage of used memory to total memory in the last polling interval.
{
Memory Used—Size of the memory used by the OPMN in the last polling intervalTotal Physical
Memory—Total physical memory of the host where the Oracle AS resides.
{
History Record—Click the History Record icon
to view the history graph of the memory
usage trend of the Oracle AS. Point to a spot on the curve to view the free memory percentage
at the specific time point. Authorized users can view memory usage statistics over the last 1 hour,
last 6 hours, today, yesterday, this week, this month, and this year by clicking the corresponding
icons on the upper right of the graph.
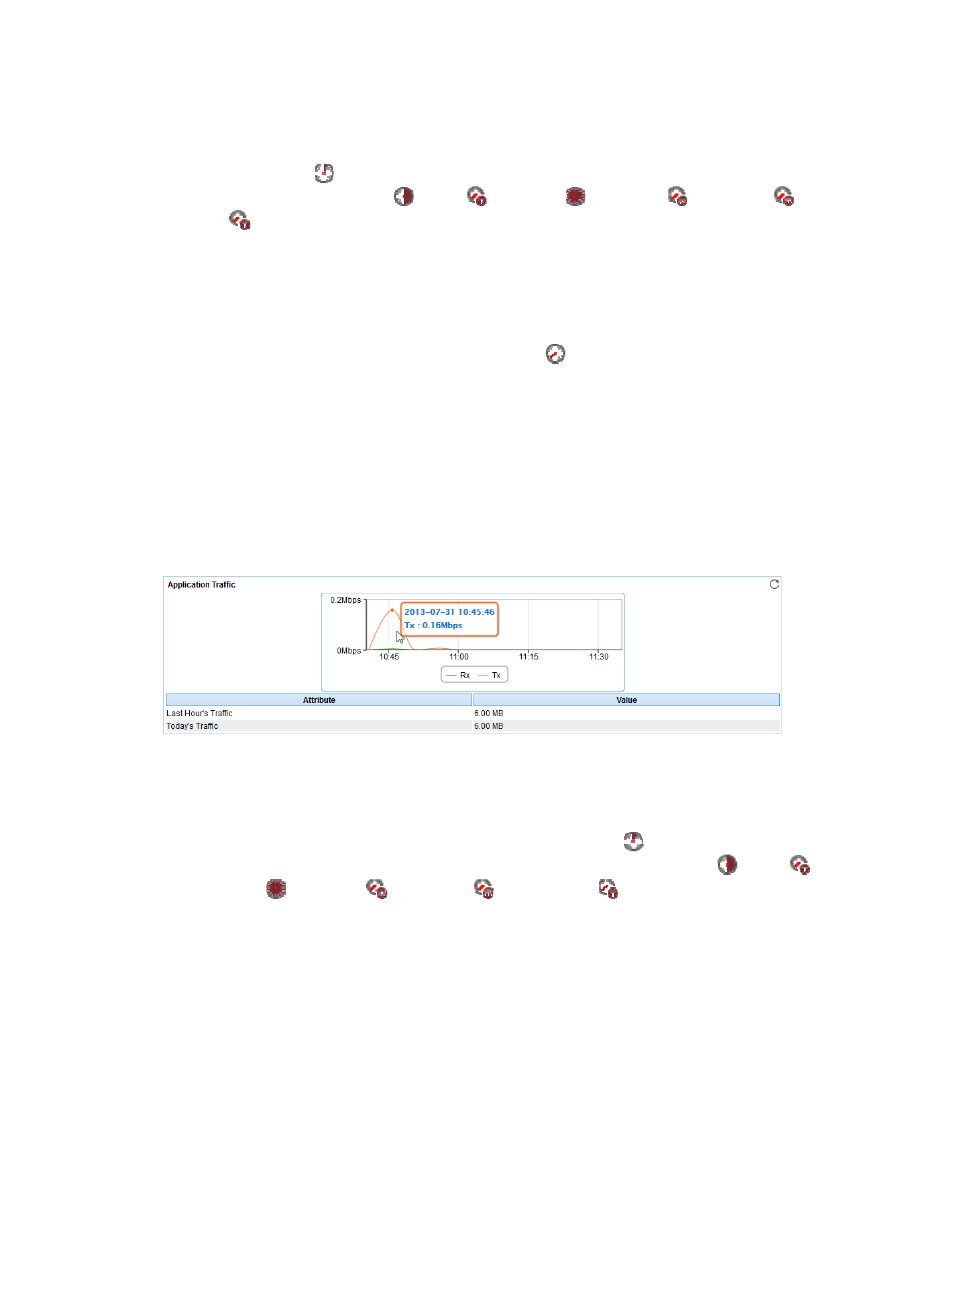
Application Traffic
The Application Traffic area layout is shown in
. APM collects the traffic statistics of the Oracle
AS based on the IP address and port number of the Oracle AS host.
Figure 286 Application Traffic area layout
Application Traffic area fields:
•
Application Traffic trend graph—Shows changes of inbound (Rx) and outbound (Tx) traffic over the
last 1 hour. The green curve shows the inbound traffic and the orange curve shows the outbound
traffic. To change the report period, click the Last 1 Hour icon
on the upper right of the graph,
and then select an icon from the list. Available options include Last 6 Hours
, Today
,
Yesterday
, This Week
, This Month
, and This Year
. Point to a spot on the curve to view
the application traffic at the specific time point. Click Rx or Tx to display or hide the corresponding
monitor index in the graph.
•
Attribute/Value—Monitor index name and data that was obtained when APM last polled the
Oracle AS.
{
Last Hour's Traffic—Total traffic sent and received by the Oracle AS over the last 1 hour.
{
Today's Traffic—Total traffic sent and received by the Oracle AS since 00:00 today.
JVM Details
APM monitors the performance of the Java virtual machine (JVM) in which the Oracle AS is running and
displays the monitoring details in the JVM Details area, as shown in