Availability state, Service, Figure 369 – H3C Technologies H3C Intelligent Management Center User Manual
Page 451
437
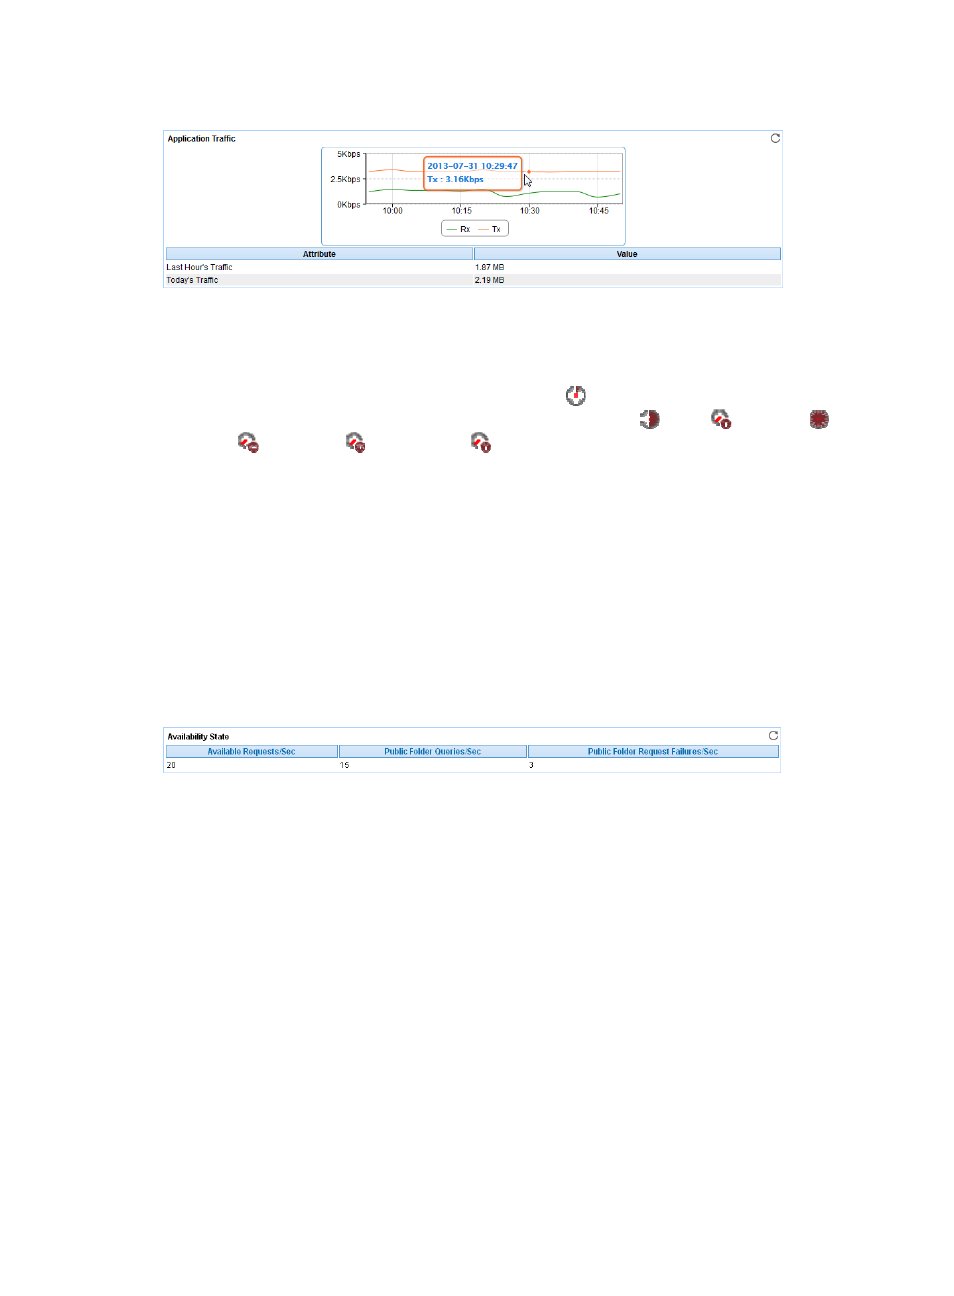
Figure 369 Application Traffic area layout
Application Traffic area fields:
•
Application Traffic trend graph—Shows changes of inbound and outbound traffic over the last 1
hour. The green curve shows the inbound traffic and the orange curve shows the outbound traffic.
To change the report period, click the Last 1 Hour icon
on the upper right of the graph, and then
select an icon from the list. Available options include Last 6 Hours
, Today
, Yesterday
, This
Week
, This Month
, and This Year
. Point to a spot on the curve to view the application
traffic at the specific time point. Click Rx or Tx to display or hide the corresponding monitor index
in the graph.
•
Attribute/Value—Monitor index name and data that was obtained when APM last polled
Exchange 2007.
{
Last Hour's Traffic—Total traffic sent and received by Exchange 2007 server over the last 1
hour.
{
Today's Traffic—Total traffic sent and received by Exchange 2007 server since 00:00 today.
Availability State
The Availability State area layout is shown in
.
Figure 370 Availability State area layout
Availability State area fields:
•
Available Requests/Sec—Number of client requests received by the availability service per second.
•
Public Folder Queries/Sec—Number of client requests to get the availability information from
public folders per second.
•
Public Folder Request Failures/Sec—Number of client request failures to get the availability
information from public folders per second.
Service
The Service area monitors the following Exchange Server 2007 services:
•
Microsoft Exchange Active Directory Topology
•
Microsoft Exchange Anti-spam Update
•
Microsoft Exchange EdgeSync
•
Microsoft Exchange File Distribution
•
Microsoft Exchange IMAP4
•
Microsoft Exchange Information Store