Ldap statistics – H3C Technologies H3C Intelligent Management Center User Manual
Page 493
479
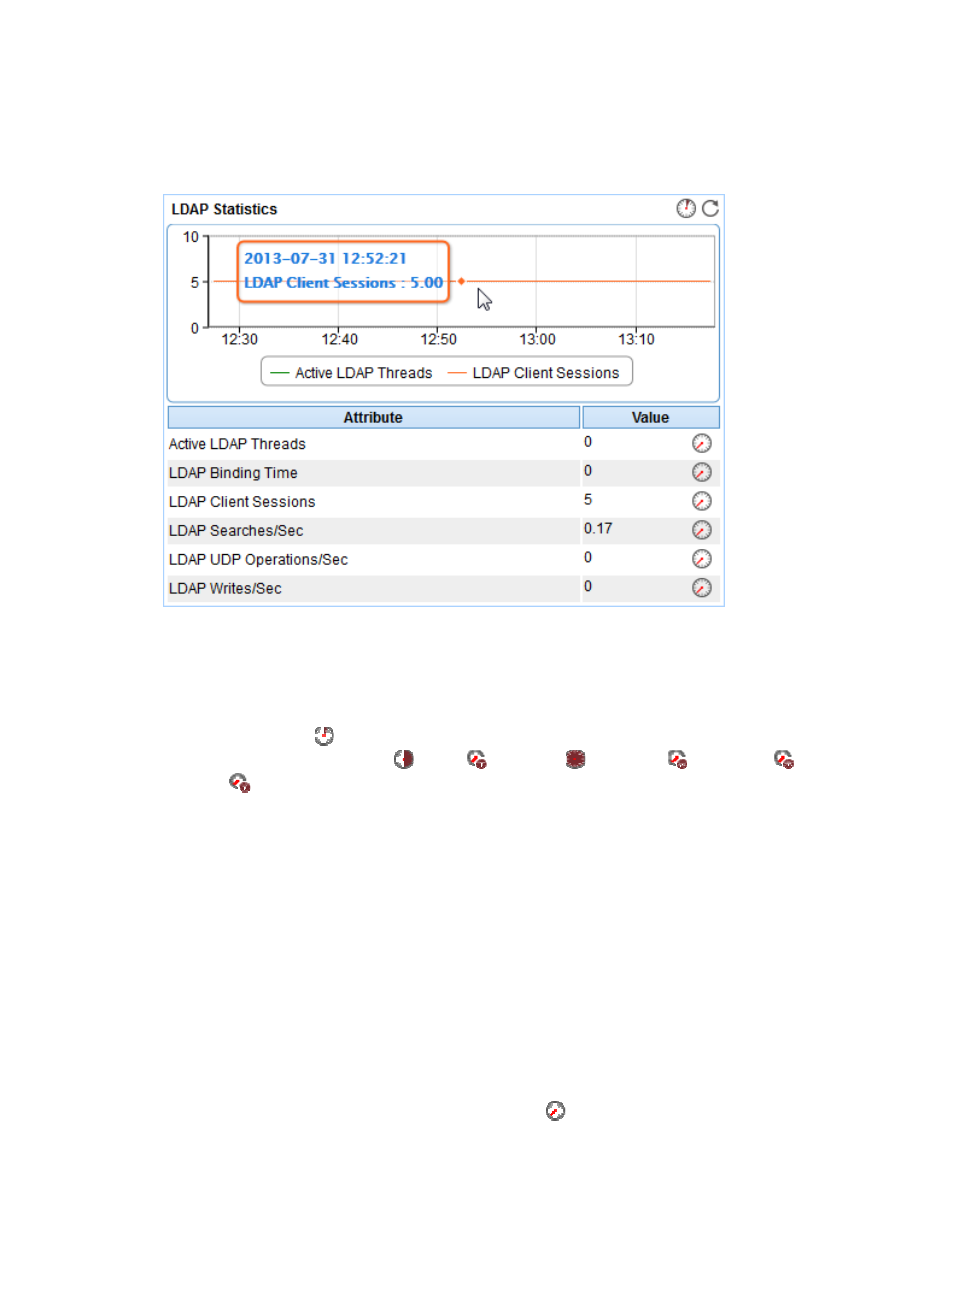
LDAP Statistics
The LDAP Statistics are shown in
Figure 399 LDAP Statistics area layout
LDAP Statistics area fields:
•
LDAP statistics trend graph—Shows changes of the number of active LDAP threads/LDAP client
sessions over the last 1 hour in a line chart. Point to a spot on the curve to view the number of active
LDAP threads/LDAP client sessions at the specific time point. To change the report period, click the
Last 1 Hour icon
on the upper right of the graph, and then select an icon from the list. Available
options include Last 6 Hours
, Today
, Yesterday
, This Week
, This Month
, and This
Year
.
•
Attribute/Value—Monitor index name and data.
{
Active LDAP Threads—Number of threads used by the LDAP subsystem in the last APM polling
period.
{
LDAP Binding Time—Time used for the last LDAP binding in the last APM polling period.
{
LDAP Client Sessions—Number of currently connected LDAP client sessions in the last APM
polling period.
{
LDAP Searches/Sec—Number of searches performed by LDAP clients per second in the last
APM polling period.
{
LDAP UDP Operations/Sec—Number of UDP operations processed by the LDAP subsystem per
second in the last APM polling period.
{
LDAP Writes/Sec—Number of writes performed by LDAP clients per second in the last APM
polling period.
{
History Record—Click the History Record icon
to view the history graph of the LDAP
statistics trend. Point to a spot on the curve to view the LDAP statistics at the specific time point.
Authorized users can view the LDAP statistics over the last 1 hour, last 6 hours, today, yesterday,