Class monitoring, Pears, as shown in, Figure 20 – H3C Technologies H3C Intelligent Management Center User Manual
Page 49
35
{
CPU—CPU usage of the operating system. Click the History Record icon
to view the history
CPU usage trend graph. Options include Last 1 Hour icon
, Last 6 Hours icon
, Today
icon ,
Yesterday icon
, This Week icon
, This Month icon
, and This Year icon
.
{
Memory—Memory usage of the operating system. Click the History Record icon
to view the
history memory usage trend graph. Options include Last 1 Hour icon
, Last 6 Hours icon
,
Today icon
, Yesterday icon
, This Week icon
, This Month icon
, and This Year
icon .
{
System Running Time—Duration from the time when the OS started up to the time when APM
most recently polled the OS.
{
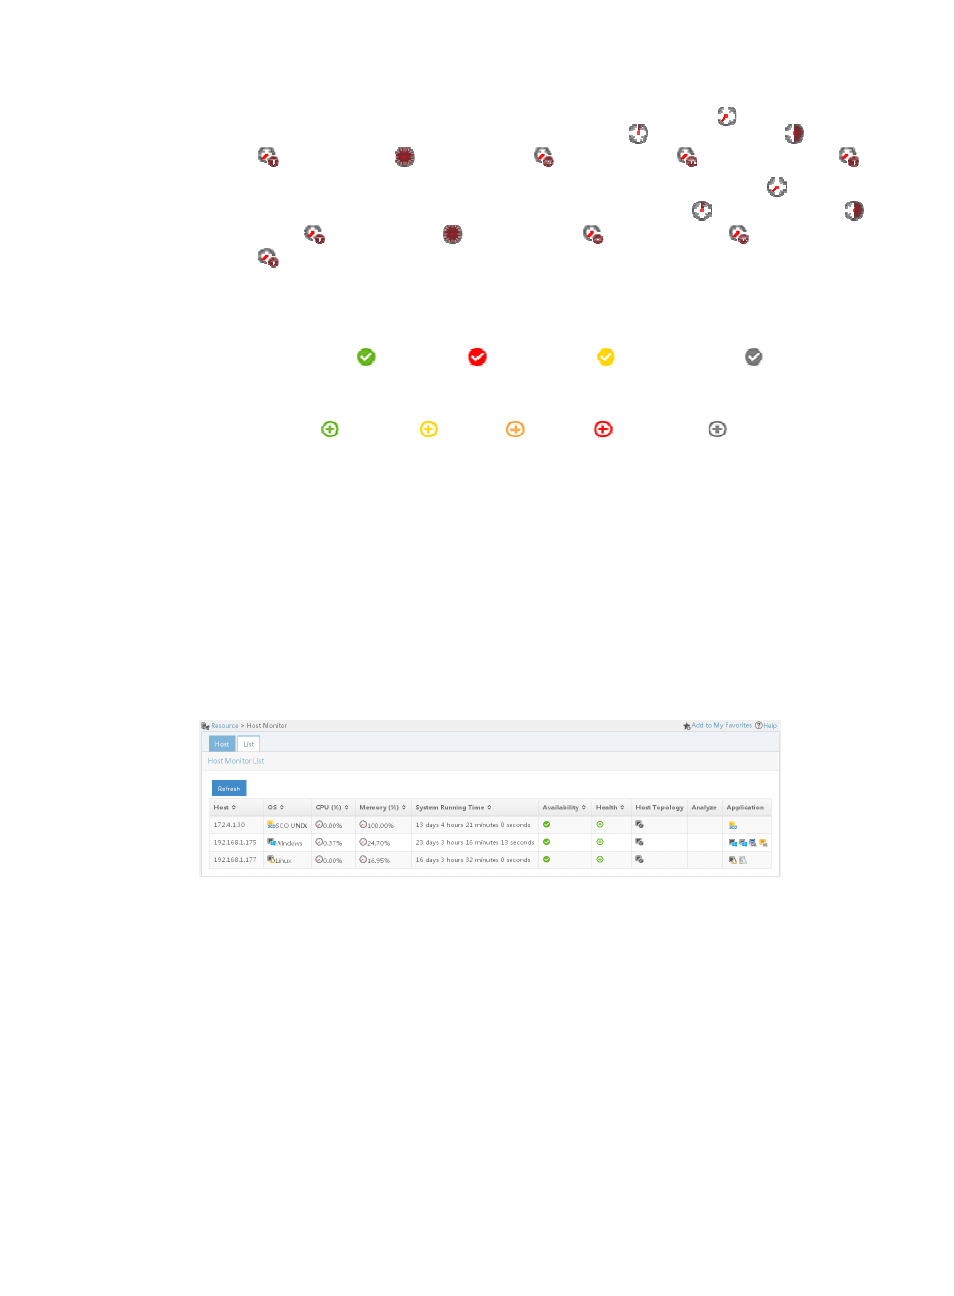
Availability—Availability of the operating system of the host for the last poll query. The
availability can be
(Available),
(Unavailable),
(Inaccessible), or
(Unmanaged).
Point to the icon to view the availability represented by different colors for the last hour.
{
Health—Health status of the operating system on the host for the last poll query. The health
status can be
(Healthy),
(Minor),
(Major),
(Critical), or
(Unknown). Health
status of the application for the last polling query. Point to the icon to view the health status
represented by different colors in the last hour.
{
Host Topology—Click the Host Topology icon to view the host and related monitored
applications in a topology view. For more information about the host topology, see "
and application group management
{
Analyze—Click the Analyze icon to view the root cause analysis for the application. For more
information, see "
{
Application—Monitored applications on the host, except the operating system. Click an
application icon to view the monitoring report for the application.
4.
Click Refresh to update the content of the Host Monitor List.
Figure 20 Host monitor list
Class monitoring
Class monitoring focuses on the health status of applications. Application types are defined in APM.
Every application type can have more than one application and the health status of the application
depends on the worst health status.
To view application monitors by class:
1.
Click the Resource tab.
2.
Select Application Manager > Class Monitor from the navigation tree.
The Class Monitor page displays all application monitors based on their classes and types, as
shown in
. The leftmost column displays the monitor classes and other columns are