H3C Technologies H3C Intelligent Management Center User Manual
Page 564
550
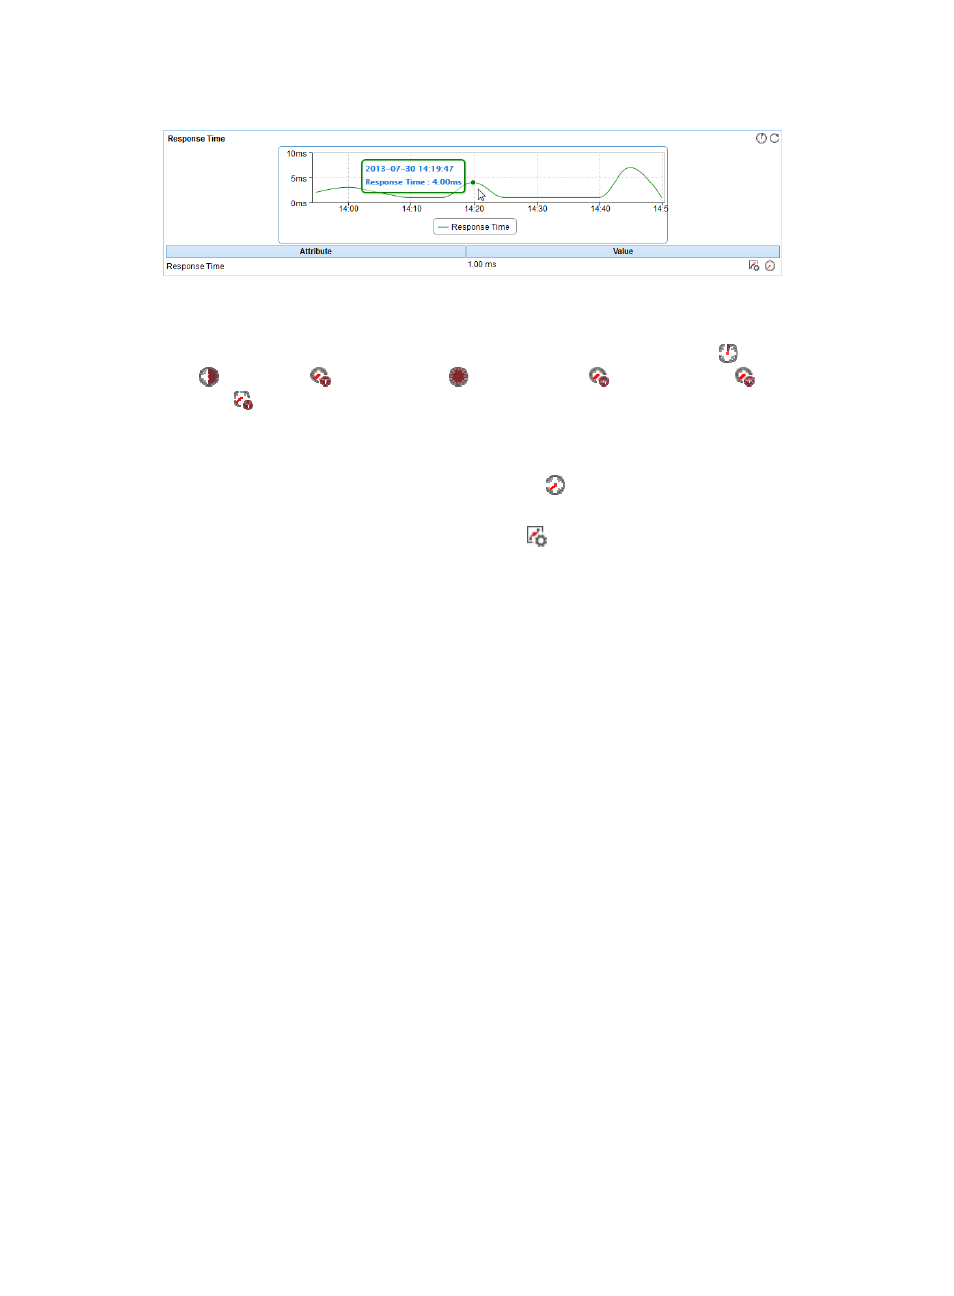
Figure 455 Response Time area layout
•
Response Time trend graph—Shows the change trend of the response time of TCP Port over the last
1 hour. Point to a spot on the curve to view the response time at the specified time point. View the
response time over the specified time period by clicking the Last 1 Hour icon
, Last 6 Hours icon
, Today icon
, Yesterday icon
, This Week icon
, This Month icon
, and This Year
icon .
•
Attribute/Value—Monitor index name and data.
{
Response Time—Duration that APM occupies to connect to TCP Port most recently.
{
History Record—Click the History Record icon
to view the change trend of the response
time in last 1 hour, last 6 hours, today, yesterday, this week, this month, or this year.
{
Set Threshold—Click the Set Threshold icon
to set alarm thresholds for the response time.
The data is highlighted in orange when the response time reaches the level-1 threshold, and is
highlighted in red when the response time reaches the level-2 threshold. You can set global
thresholds or custom thresholds. For information about setting the thresholds, see "