Archived logs – H3C Technologies H3C Intelligent Management Center User Manual
Page 280
266
•
Connection Information trend graph—Shows the change trend of the connection number over the
last 1 hour. Point to a spot on the curve to view the connection number at the specified time point.
View the changes of the connection number over the specified time period by clicking the Last 1
Hour icon
, Last 6 Hours icon
, Today icon
, Yesterday icon
, This Week icon
, This
Month icon
, and This Year icon
.
•
Attribute/Value—Monitor index name and data.
{
Current Connections—Number of connections used in the most recent polling interval.
{
Max. Connections—Maximum number of connections allowed by Oracle. If the Current
Connections value reaches the Max. Connections value, new connections cannot be
established.
{
History Record—Click the History Record icon
to view the change trend of the connection
number in last 1 hour, last 6 hours, today, yesterday, this week, this month, or this year.
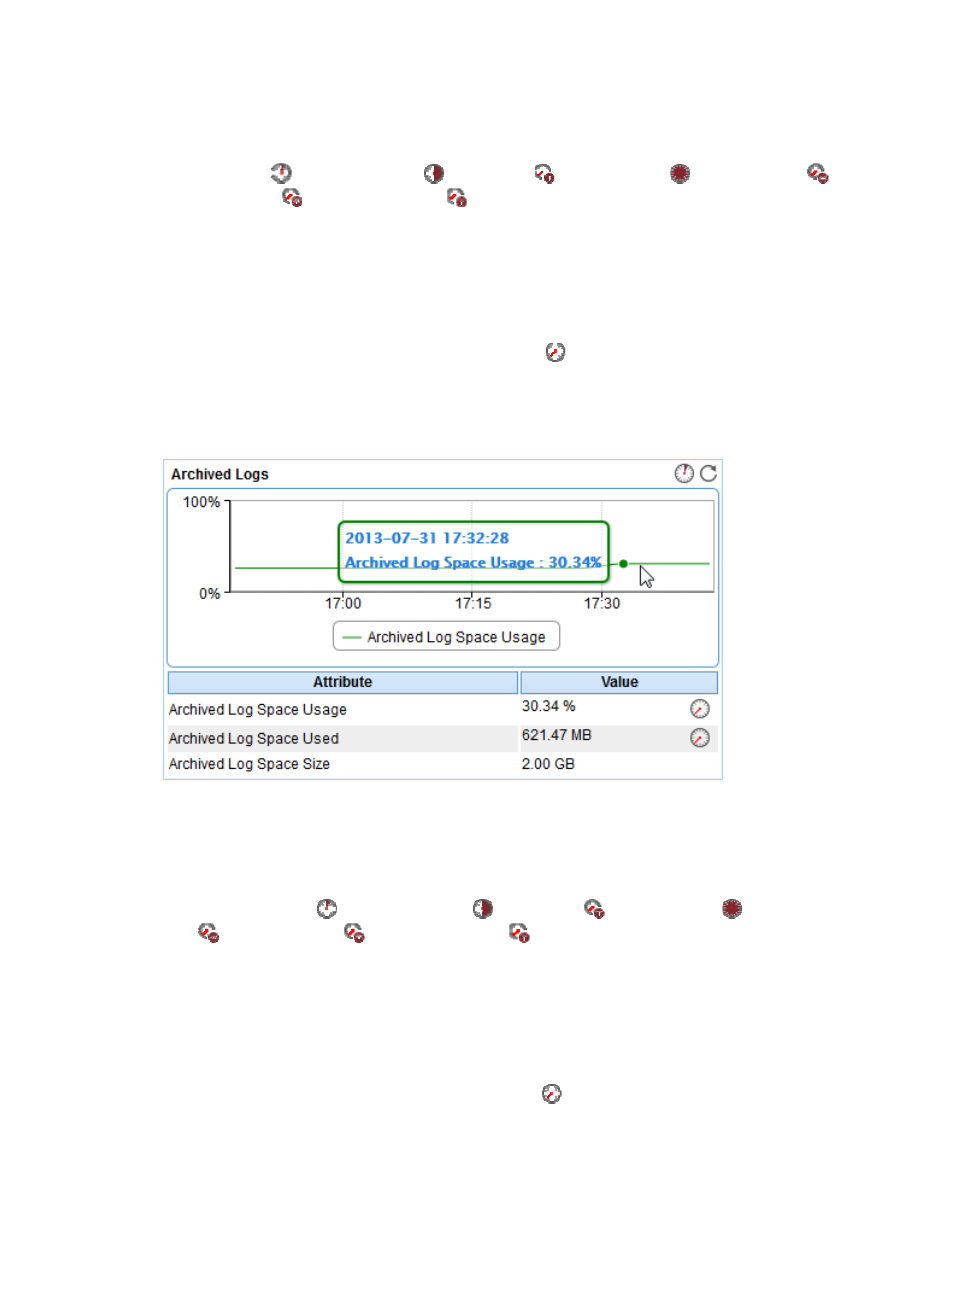
Archived Logs
Figure 216 Archived Logs area layout
Archived Logs area fields:
•
Archived Logs trend graph—Shows the change trend of the archived log space usage over the last
1 hour. Point to a spot on the curve to view the archived log space usage at the specified time point.
View the changes of the archived log space usage over the specified time period by clicking the
Last 1 Hour icon
, Last 6 Hours icon
, Today icon
, Yesterday icon
, This Week icon
, This Month icon
, and This Year icon
.
•
Attribute/Value—Monitor index name and data.
{
Archived Log Space Usage—Usage of archived log space in the most recent polling interval
(Archived Log Space Usage = Archived Log Space Used/Archived Log Space Size x 100%).
{
Archived Log Space Used—Archived log space used in the most recent polling interval.
{
Archived Log Space Size—Size of archived log space.
{
History Record—Click the History Record icon
to view the change trend of the archived log
space data in last 1 hour, last 6 hours, today, yesterday, this week, this month, or this year.