Web application – H3C Technologies H3C Intelligent Management Center User Manual
Page 391
377
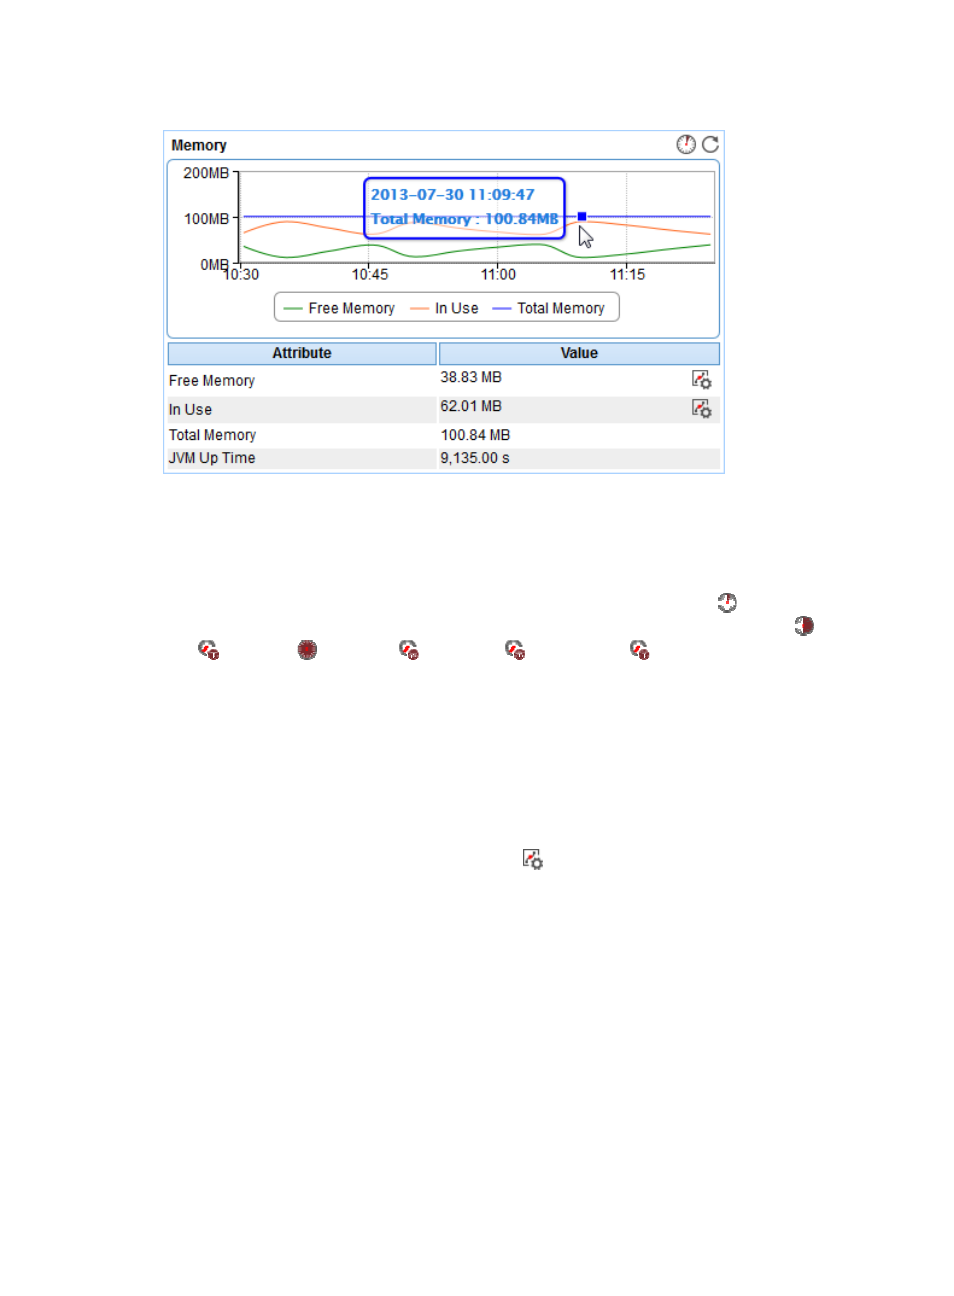
Figure 317 Memory area layout
Memory area fields:
•
Memory usage trend graph—Shows changes of the sizes of the free memory, used memory, and
total memory of the WebSphere server over the selected time period in a line graph. Point to a spot
in the curve to view the memory usage data at the specific time point. By default, the graph shows
the last 1 hour data. To change the report period, click the Last 1 Hour icon
on the upper right
of the graph, and then select an icon from the list. Available options include Last 6 Hours
, Today
, Yesterday
, This Week
, This Month
, and This Year
. Click Free Memory, In Use, or
Total Memory to display or hide the corresponding monitor index in the graph.
•
Attribute/Value—Monitor index name and data.
{
Free Memory—Unused memory in the JVM heap in last polling interval.
{
In Use—Used memory in the JVM heap in last polling interval.
{
Total Memory—Total memory of the JVM heap.
{
JVM Up Time—Total time the JVM had been running since the WebSphere server started until
the last polling interval.
{
Set Threshold—Click the Set Threshold icon
to set alarm thresholds for the free memory size
or used memory size. The data is highlighted in yellow when it reaches the level-1 threshold,
and is highlighted in red when it reaches the level-2 threshold. Use the global thresholds or
self-defined thresholds. For information about setting the thresholds, see "
Web Application
The Web Application area is as shown in
.